please give an explanation on how to work these problems. I keep getting stuck. Thank you
1
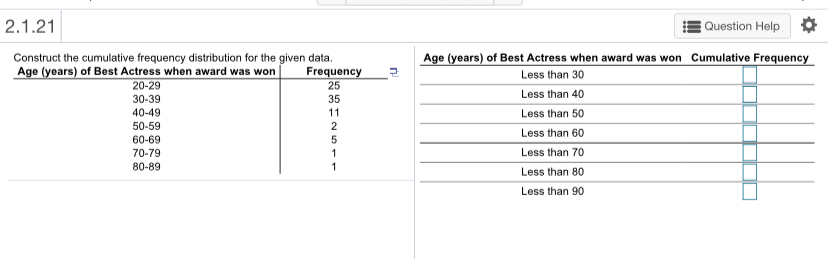
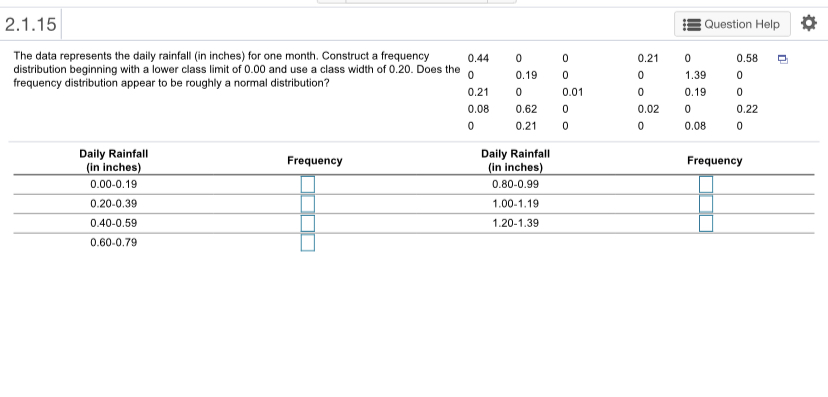
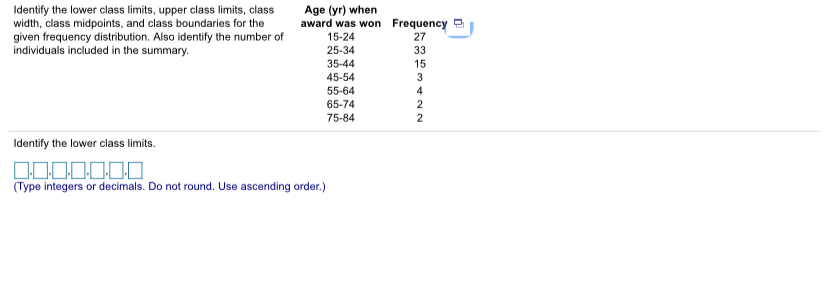
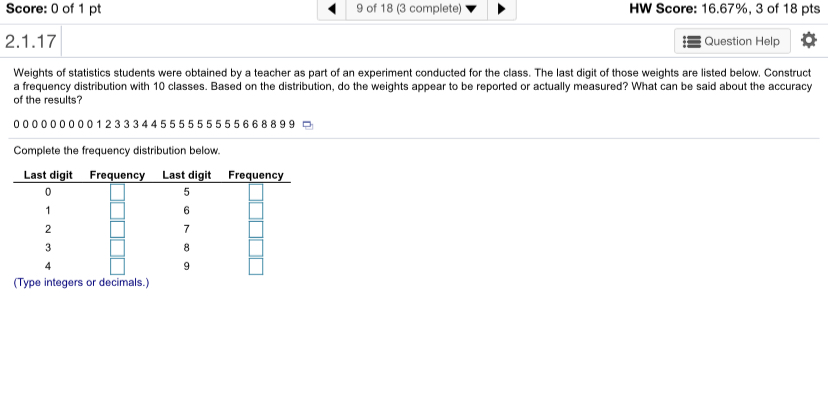
2.1.21 Question Help Construct the cumulative frequency distribution for the given data. Age (years) of Best Actress when award was won Frequency Age (years) of Best Actress when award was won Cumulative Frequency 20-29 25 Less than 30 30-39 35 Less than 40 40-49 11 50-59 Less than 50 60-69 Less than 60 70-79 Less than 70 80-89 Less than 80 Less than 902.1.15 Question Help The data represents the daily rainfall (in inches) for one month. Construct a frequency 0.44 0 0.21 0 0.58 distribution beginning with a lower class limit of 0.00 and use a class width of 0.20. Does the frequency distribution appear to be roughly a normal distribution? 0.19 0 1.39 0 0.21 0 0.01 0 0.19 0 0.08 0.62 OO 0.02 0 0.22 0.21 0.08 0 Daily Rainfall (in inches) Frequency Daily Rainfall (in inches) Frequency 0.00-0.19 0.80-0.99 0.20-0.39 1.00-1.19 0.40-0.59 1.20-1.39 0.60-0.79Identify the lower class limits, upper class limits, class Age (yr) when width, class midpoints, and class boundaries for the award was won Frequency given frequency distribution. Also identify the number of 15-24 27 individuals included in the summary. 25-34 33 35-44 15 45-54 55-64 65-74 75-84 NN AD Identify the lower class limits. 0.0.0.0.0.0.0 (Type integers or decimals. Do not round. Use ascending order.)Score: 0 of 1 pt 9 of 18 (3 complete) HW Score: 16.67%, 3 of 18 pts 2.1.17 Question Help Weights of statistics students were obtained by a teacher as part of an experiment conducted for the class. The last digit of those weights are listed below, Construct a frequency distribution with 10 classes. Based on the distribution, do the weights appear to be reported or actually measured? What can be said about the accuracy of the results? 0000000001233344555555655668899 Complete the frequency distribution below. Last digit Frequency Last digit Frequency 0 (Type integers or decimals.)Construct one table that includes relative frequencies based on the frequency distributions shown below, then compare the amounts of tar in nonfiltered and filtered cigarettes. Do the cigarette filters appear to be effective? (Hint: The filters reduce the amount of tar ingested by the smoker.) Eff Click the icon to view the frequency distributions. Complete the relative frequency table below. Relative Relative Frequency Frequency Tar (mg) (Nonfiltered) (Filtered) 3-6 % 7-10 % 11 - 14 7% 15-18 7% % 19-22 7% % 23 -26 7% 27 - 30 (Simplify your answers. ) i Frequency Distributions - X Tar (mg) in Tar (mg) in Nonfiltered Filtered Cigarettes Frequency Cigarettes 11 -14 Frequency 3-6 15 - 18 3 19 -22 2 7 - 10 15 23 -26 11 - 14 6 15 - 18 15 27 - 30 Print Done2.1.22 Question Help Construct the cumulative frequency distribution for the given data. Cumulative Daily Low ( F) Frequency Daily Low Temperature ("F) Frequency 35-39 Less than 40 40-44 45-49 Less than 45 50-54 Less than 50 55-59 60-64 Less than 55 65-69 Less than 60 Construct the cumulative frequency distribution. Less than 65 Less than 702.1.16 Question Help Refer to the accompanying data set and use the 25 home voltage measurements to construct a frequency distribution with five classes. Begin with a lower class limit of 126.5 volts, and use a class width of 0.2 volt. Does the result appear to have a normal distribution? Why or why not? Click the icon to view the data Complete the frequency distribution below. Voltage (volts) Frequency 126.5 - (Type integers or decimals rounded to the nearest tenth as needed.) i More Info - X Voltage Measurements From a Home Home Home Home Home Full Day (volts) Day (volts) Day (volts) Day (volts) data 126.7 8 126.8 15 127.1 22 127.4 set 126.6 9 126.6 16 127.2 23 127.3 3 127.0 10 127.1 17 127.4 24 126.8 4 127.1 11 127.0 18 126.7 25 126.9 5 127.4 12 127.4 19 126.5 6 126.6 13 20 127.3 7 126.9 126.6 14 126.8 21 127.1 Print DoneRefer to the table summarizing service times (seconds) of Time (sec) Frequency dinners at a fast food restaurant. How many individuals are 60-119 7 included in the summary? Is it possible to identify the exact 120-179 22 values of all of the original service times? 180-239 15 240-299 1 300-359 4 individuals are included in the summary. (Type a whole number.)Refer to the accompanying data set and use the 30 screw lengths to construct a frequency distribution. Begin with a lower class limit of 2.970 in., and use a class width of 0.010 in. The screws were labeled as having a length of 3 in. Click on icon to view the data. Complete the frequency distribution below. Length (in.) Frequency 2.970- (Type integers or decimals rounded to the nearest thousandth as needed.) i Data Table X Screw Lengths (inches) 2.972 3.008 3.003 2.973 2.981 2.996 3.008 2.975 3.003 3.001 3.009 2.993 2.994 2.987 3.009 3.002 2.981 3.008 2.999 3.004 2.991 3.018 3.004 3.005 2.999 2.981 3.008 2.981 3.002 2.994 Print Done