Please, give detail and show where the answer come from step by step. If you want to do it via excel, that would be better. Also, please don't do it if you are not sure about the answer because that will harm me.

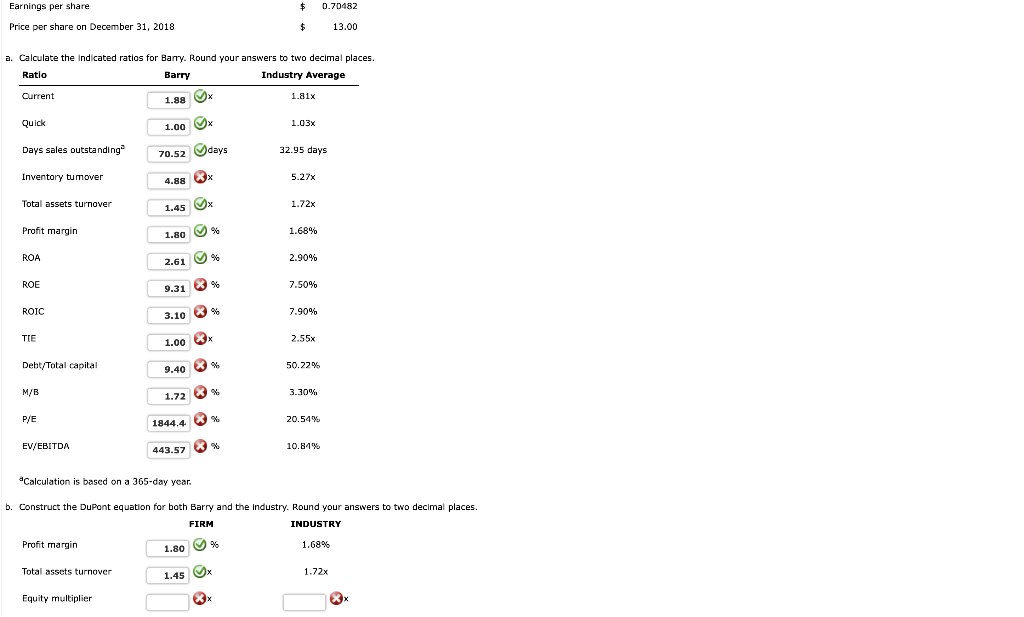
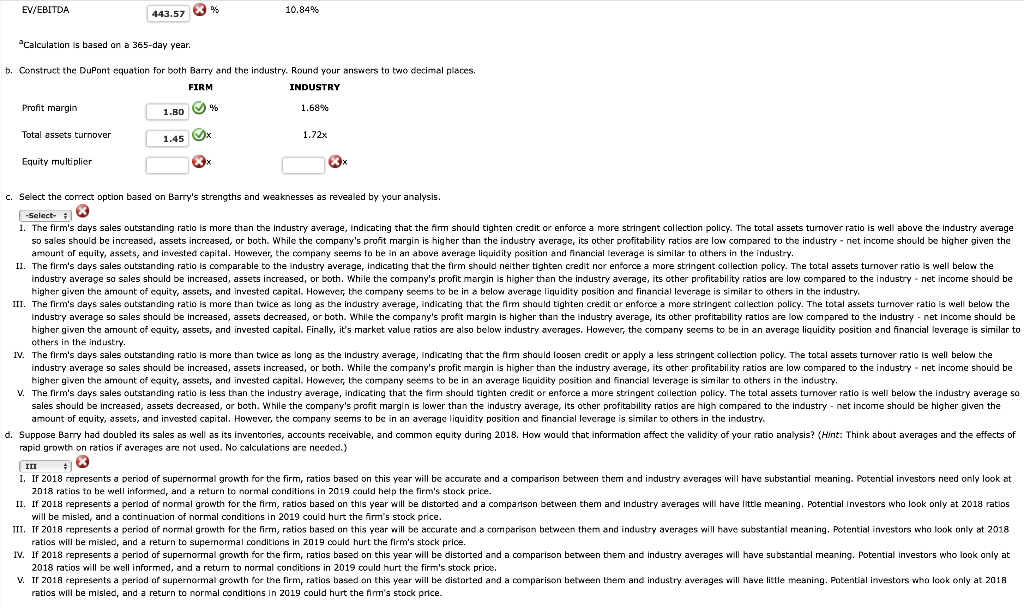
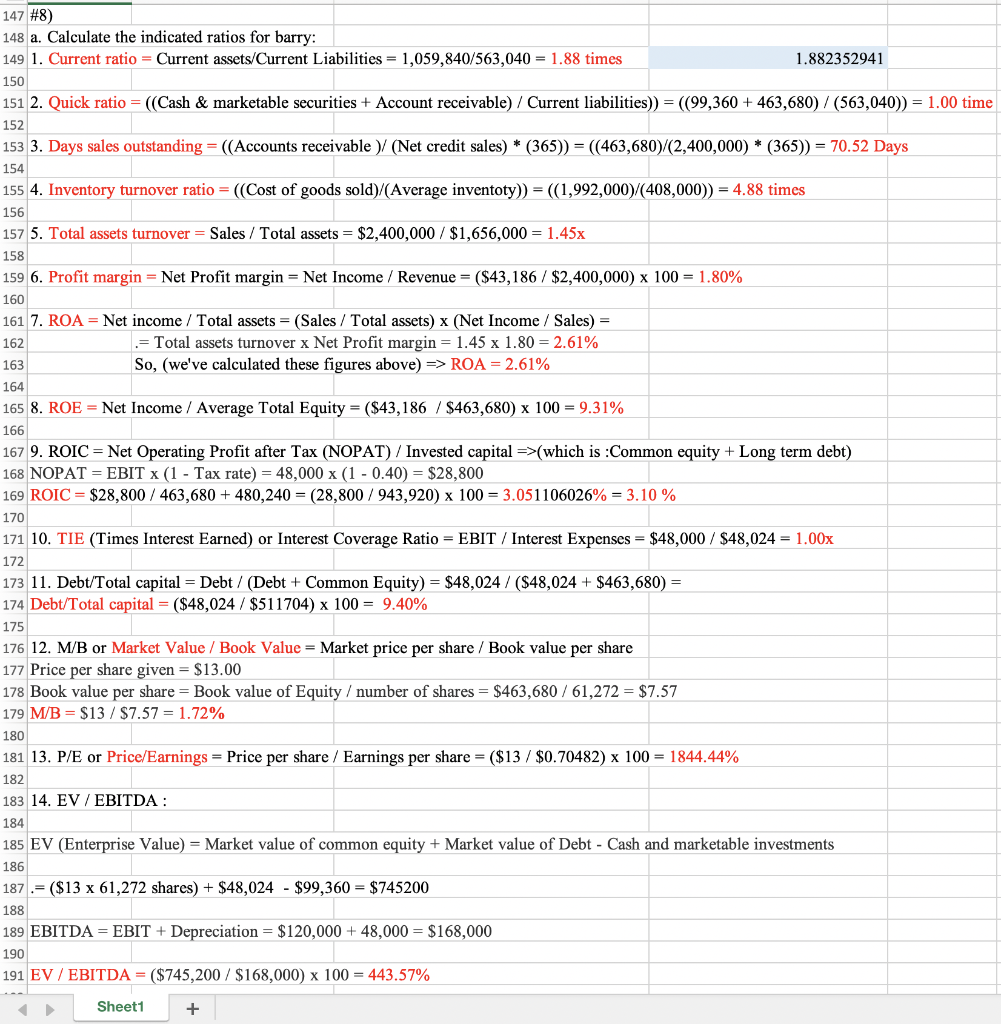
Data for Barry Computer Co. and its industry averages follow. The firm's debt is priced at par, so the market value of its debt equals its book value. Since dollars are in thousands, number of shares are shown in thousands too. Barry Computer Company: Balance Sheet as of December 31, 2018 (In Thousands) Cash Receivables Inventories $99,360 463,690 196,800 $1,059,840 $182,160 215,280 155,600 $563,040 $480,240 612,720 Accounts payable Other current liabilities Notes payable to bank Total current assets Total current liabilities Long-term debt Common equity (61,272 shares) Total labilities and equity $1,656,000 Net fixed assets 596,160 Total assets $1,556,000 Barry Computer Company: Income Statement for Year Ended December 31, 2018 (In Thousands) Sales S2,400,000 Cost of goods sold Materials Labor Heat, light, and power Indirect labor Depreciation $1,030,000 552,000 168,000 111,000 48,000 1,992,000 408,000 216,000 72,000 $120,000 48,024 $71,976 28,790 $43,186 D.70482 Gross profit Selling expenses General and administrative expenses Earnings before interest and taxes (EBIT) Interest expense Earnings before taxes (EBT) Federal and state income taxes (4096) Net income Earnings per share Earnings per shane 0.7D482 Price per share on December 31, 2018 13.00 a. Calculate the indicated ratios for Bary. Round your answers to two decimal places. Ratio Barry Industry Average Current 1.81x 1.88 Quick Days sales outstanding' Inventory tumover 1.03x 1.00 32.95 days 5.27x 1.72x 70.52 4.88 Total assets turnover 1.45 Profit margin 1.68% 1.80 2.90% 7.50% 7.90% ROA 2.61 ROE 9.31 ROIC 3.10 TIE 2.55x 1.00 Deht/Total capital 50.22% 9.40 3.30% 1.72 P/E 20.54% 1844.4 EVyEBITDA 10.84 % 443.57 Calculation is based on a 365-day year. b. Construct the DuPont equation for both Barry and the industry. Round your answers to two decimal places. FIRM INDUSTRY 1.68% 1.72x Profit margin 26 1.80 Total assets turnover 1.45 Equity multiplier Calculation is based on a 365-day year. b. Construct the DuPont equation for both Barry and the industry. Round your answers to two decimal places. c. Select the correct option based on Barry's strengths and weaknesses as revealed by your analysis. I. The firm's days sales outstanding ratio is more than the industry average, Indicating that the firm should tighten credit or enforce a more stringent collection policy. The total assets turnover ratio is well above the industry average amount of equity, assets, and invested capital. However, the company seems to he in an above average liquidity position and financial leverage is similar to athers in the industry. higher given the amount cf equit , assets, and invested capital. However, the company seems o be in below average liquidity position and financial leverage is similar to others in the industry. industry average so sales should be increased, assets decreased, or both. While the company's profit margin is higher than the industry average, its other profitability ratios are low compared to the industry net income should be higher given the amount of equity, assets, and invested capital. Finally, it's market value ratios ore also below industry averages. However, he company seems o be in an average liquidity position nd financial leverage is similar to industry average so sales should be increased, assets increased, or both. While the company's profit margin is higher than the industry average, its other profitability ratios are low compared to the industry - net income should be higher given the amount of equity, assets, and invested capital. However, the company seems to be in an average liquidity position and financial leverage is similar to others in the industry. V. The firm's days sales outstanding ratio is less than the industry average, indicating that the firm should tighten credit or enforce a more stringent collection policy. The total assets tumover ratio is well below the industry average so amount of cquity, assets, and invested capital, However, the company seems to be in an average liquidity position and financial leverage is similar to others in the industry rapid growth on ratics if avcrages are not used. No calculations are nceded.) 2018 ratios to e well informed, and a return to normal conditions in 2019 could help the firm's stock price will be misled, and a continuation of normal conditions in 2019 could hurt the firm's stock price ratios will be misled, and a return to supemomal conditions in 2019 could hurt the firm's stock price. 2018 ratios will be well informed, and a returm to normal conditions in 2019 could hurt the firm's stock price ratios will be misled, and a return to normal conditions in 2019 could hurt the firm's stock price. V. IT 2018 represents a period af supernormal growth for the firm, ratios based on this year will he distorted and a comparison between them and industry averages will have little meaning. Putential investors who lcok only at 201B 147 #8) 148 a. Calculate the indicated ratios for barry: 1491. Current ratio Current assets/Current Liabilities- 1,059,840/563,040 1.88 times 150 1512. Quick ratio ((Cash & marketable securities + Account receivable) / Current liabilities)) = ((99,360 + 463,680) / (563,040)) = 1.00 time 152 1533. Days sales outstanding = ((Accounts receivable )/ (Net credit sales) * (365)) = (463,680)(2,400,000) * (365)) = 70.52 Days 154 1554. Inventory turnover ratio-((Cost of goods sold)/(Average inventoty)) = ((1992,000)(408,000)) = 4.88 times 156 157 5. Total assets turnover Sales /Total assets $2,400,000 / $1,656,000 1.45x 158 1596. Profit margin-Net Profit margin-Net Income / Revenue-($43,186 / $2,400,000) x 100-1.80% 160 1617. ROA = Net income / Total assets (Sales / Total assets) x (Net Income / Sales) 162 163 164 1658. ROE-Net Income / Average Total Equity-($43,186 / $463,680) x 100-9.31% 166 1679. ROIC Net Operating Profit after Tax (NOPAT) / Invested capital ->(which is :Common equity + Long term debt) 168 NOPAT EBIT x (1 -Tax rate) = 48,000 x (1-0.40) = $28,800 169 ROIC $28,800 / 463,680 480,240-(28,800 / 943,920) x 100-3.05 1 1 06026%-3.10 % 170 171 10. TIE (Times Interest Earned) or Interest Coverage Ratio = EBIT / Interest Expenses $48,000 / $48,024 = 1.00x 172 173 11. Debt/Total capital-Debt / (Debt + Common Equity) $48,024 / ($48,024+ $463,680)- 174 Debt/Total capital = ($48,024 / $511 704) x 100 = 9.40% 175 176 12. M/B or Market Value/Book Value Market price per share / Book value per share 177 Price per share given = $13.00 178 Book value per share Book value of Equity / number of shares = $463,680 / 61,272 $7.57 179 M/B-$13 / $7.57-1.72% 180 18113, P/E or Price/Earnings-Price per share / Earnings per share-($13 / $0.70482) x 100-1844.44% 182 183 14. EV / EBITDA : 184 185 EV (Enterprise Value) = Market value of common equity + Market value of Debt-Cash and marketable investments 186 187-($13 x 61,272 shares) + $48,024 - $99,360-$745200 188 189 EBITDA = EBIT + Depreciation $120,000 + 48,000 = $168,000 190 191 EV / EBITDA-($745,200 / $168,000) x 100-443.57% 1.882352941 = Total assets turnover x Net Profit margin = 1.45 x 1.80 = 2.61% So, (we've calculated these figures above) > ROA 2.61% Sheet1