

Answered step by step
Verified Expert Solution
Question
1 Approved Answer
please give me answer as early as possible please it's my request The income statements and balance sheets for Hathaway Inc. are shown below for
please give me answer as early as possible please it's my request
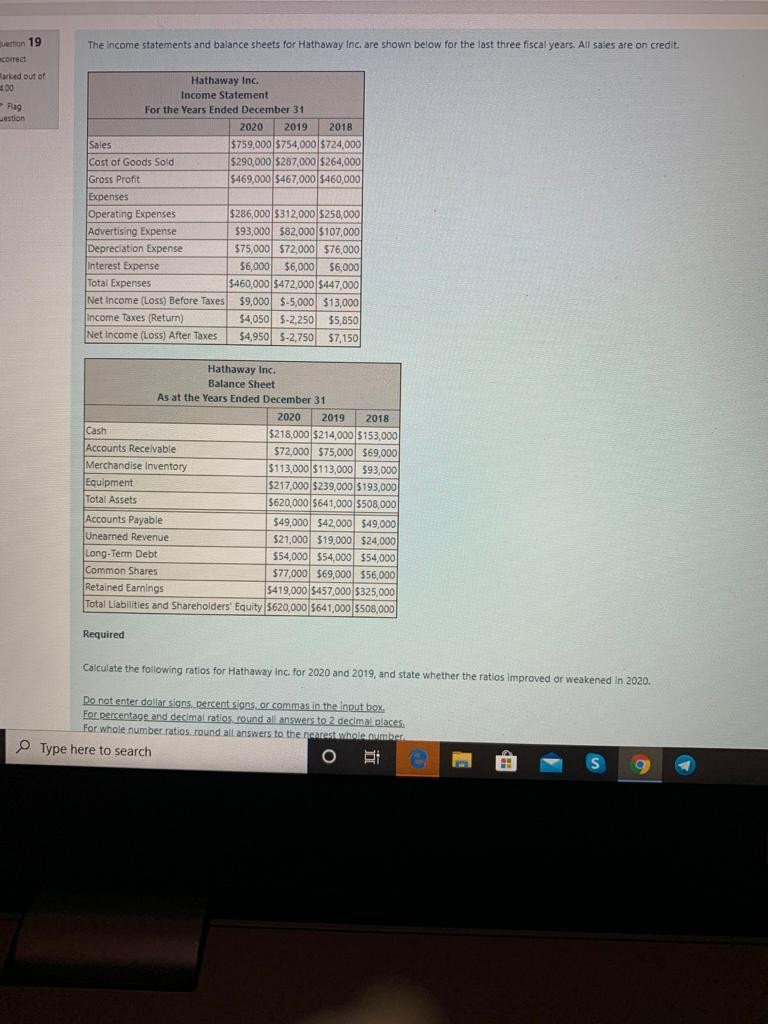
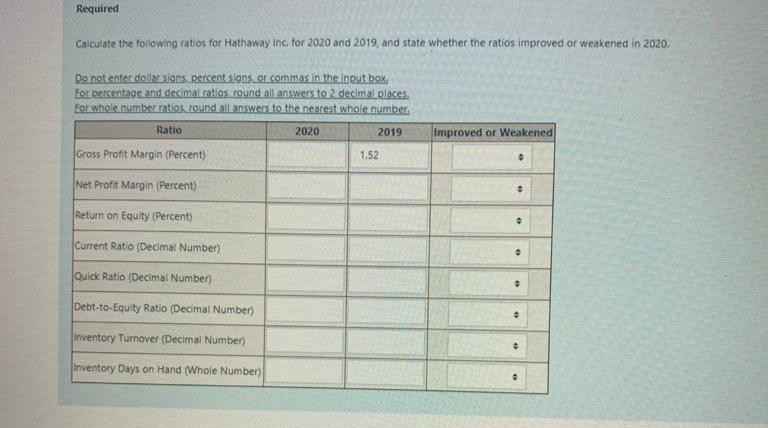
The income statements and balance sheets for Hathaway Inc. are shown below for the last three fiscal years. All sales are on Credit verton 19 correct arked out of 400 Rag westion Hathaway Inc. Income Statement For the Years Ended December 31 2020 2019 2018 Sales $759,000 $754,000 $724,000 Cost of Goods Sold $290,000 $287,000 $264,000 Gross Profit 5469,000 5467,000 $460,000 Expenses Operating Expenses $286,000 $312,000 $258,000 Advertising Expense $93,000 582,000 $107.000 Depreciation Expense $75,000 $72,000 $76,000 Interest Expense $6,000 $6,000 $6,000 Total Expenses $460,000 $472,000 $447,000 Net Income (Loss) Before Taxes $9,000 $-5,000 $13,000 Income Taxes (Return) $4,050 $-2,250 55,850 Net Income (Loss) After Taxes $4.950 5-2,750 57,150 Hathaway Inc. Balance Sheet As at the Years Ended December 31 2020 2019 2018 Cash $218,000 $214,000 $153,000 Accounts Receivable 572,000 $75,000 $69,000 Merchandise Inventory $113,000 $113,000 $93,000 Equipment $217,000 $239,000 5193,000 Total Assets $620,000 $641,000 5508,000 Accounts Payable 549,000 $42,000 $49,000 Unearned Revenue $21,000 $19,000 $24,000 Long-Term Debt 554,000 $54,000 $54,000 Common Shares $77,000 $69,000 556,000 Retained Earnings 5419,000 5457,000 $325,000 Total Liabilities and Shareholders' Equity 5620,000 $641,000 $508,000 Required Calculate the following ratios for Hathaway Inc for 2020 and 2019, and state whether the ratios Improved or weakened in 2020. Do not enter dollar signs. percent sans or commas in the input box. For percentage and decimal ratios round all answers to 2 decimal places For whole number ratios.round all answers to the nearest whole number Type here to search ORT Required Calculate the following ratios for Hathaway inc for 2020 and 2019, and state whether the ratios improved or weakened in 2020. Do not enter dortions. Recent signs.or commas in the loput box For percentage and decimal ratios. round all answers to 2 decimal places For whole number ratios round all answers to the nearest whole number Ratio 2020 2019 Gross Profit Margin (Percent) 1.52 improved or Weakened Net Profit Margin (Percent) Return on Equity (Percent) Current Ratio (Decimal Number) Quick Ratio (Decimal Number) Debt-to-Equity Ratio (Decimal Number) Inventory Turnover (Decimal Number) Inventory Days on Hand Whole Number)Step by Step Solution
There are 3 Steps involved in it
Step: 1

Get Instant Access to Expert-Tailored Solutions
See step-by-step solutions with expert insights and AI powered tools for academic success
Step: 2

Step: 3
Ace Your Homework with AI
Get the answers you need in no time with our AI-driven, step-by-step assistance
Get Started
Property Companies An Industry Accounting And Auditing Guide
Authors: Accountancy Books
1st Edition
1853558079, 978-1853558078