

Answered step by step
Verified Expert Solution
Question
1 Approved Answer
please graph log log graph for first photo using this data and find slope and intercept and other compution from the graph. for second one
please graph log log graph for first photo using this data and find slope and intercept and other compution from the graph. for second one please use semi log graph. 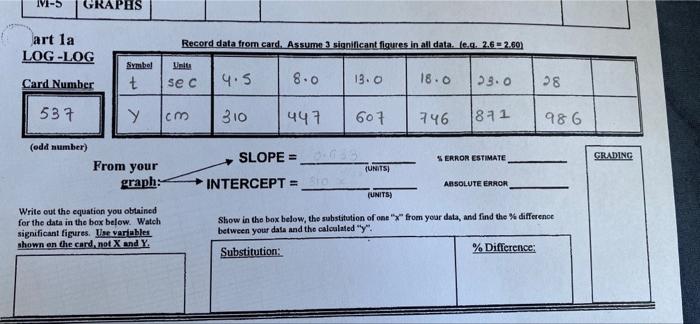
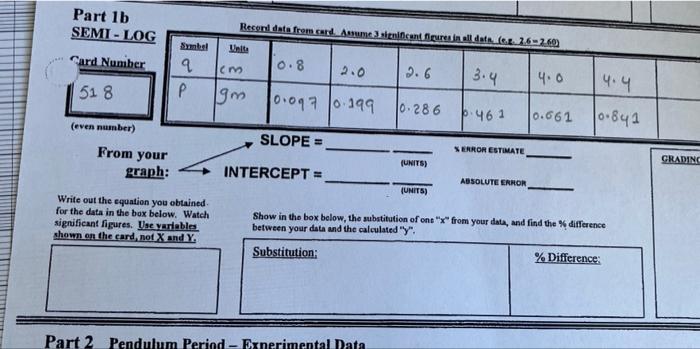
IVES art la LOG-LOG Record data from card. Assume a significant figures in all data. leg. 2.6 2.60) Untus Symbel t Card Number sec 4.5 8.0 13.0 18.0 23.0 38 & 537 Y cm 310 447 601 746 1871 986 (odd number) SLOPE = SERROR ESTIMATE GRADING From your graph: UNITS) INTERCEPT = ABSOLUTE ERROR (UNITS Write out the equation you obtained for the data in the box below. Watch significant figures. Ilse variables shown on the card, not X and Y Show in the box below, the substitution of one "x" from your data, and find the difference between your data and the calculated "y": Substitution: % Difference: Part 1b SEMI-LOG Card Number Recent data from card American Dresin all data (e. 26-260 Symbol q cm 0.8 2.0 2.6 3.4 4.0 P 9m 1o.oq7 1o. 199 1o. 286 6.461 0.661 4.4 518 10.841 (even number) SLOPE = SERROR ESTIMATE From your graph: (UNITS) GRADING INTERCEPT = ABSOLUTE ERROR (UNITS) Write out the equation you obtained for the data in the box below. Watch significant figures. Une variables shown on the card, not X and Y. Show in the box below, the substitution of one "x" from your data, and find the difference between your data and the calculated "y": Substitution: % Difference: Part 2 Pendulum Period - Experimental Data IVES art la LOG-LOG Record data from card. Assume a significant figures in all data. leg. 2.6 2.60) Untus Symbel t Card Number sec 4.5 8.0 13.0 18.0 23.0 38 & 537 Y cm 310 447 601 746 1871 986 (odd number) SLOPE = SERROR ESTIMATE GRADING From your graph: UNITS) INTERCEPT = ABSOLUTE ERROR (UNITS Write out the equation you obtained for the data in the box below. Watch significant figures. Ilse variables shown on the card, not X and Y Show in the box below, the substitution of one "x" from your data, and find the difference between your data and the calculated "y": Substitution: % Difference: Part 1b SEMI-LOG Card Number Recent data from card American Dresin all data (e. 26-260 Symbol q cm 0.8 2.0 2.6 3.4 4.0 P 9m 1o.oq7 1o. 199 1o. 286 6.461 0.661 4.4 518 10.841 (even number) SLOPE = SERROR ESTIMATE From your graph: (UNITS) GRADING INTERCEPT = ABSOLUTE ERROR (UNITS) Write out the equation you obtained for the data in the box below. Watch significant figures. Une variables shown on the card, not X and Y. Show in the box below, the substitution of one "x" from your data, and find the difference between your data and the calculated "y": Substitution: % Difference: Part 2 Pendulum Period - Experimental Data Step by Step Solution
There are 3 Steps involved in it
Step: 1

Get Instant Access to Expert-Tailored Solutions
See step-by-step solutions with expert insights and AI powered tools for academic success
Step: 2

Step: 3
Ace Your Homework with AI
Get the answers you need in no time with our AI-driven, step-by-step assistance
Get Started
Corporate Finance Laws And Corporate Social Responsibility In India
Authors: S. K. Saini
1st Edition
3659506117, 9783659506116