.....Please help.
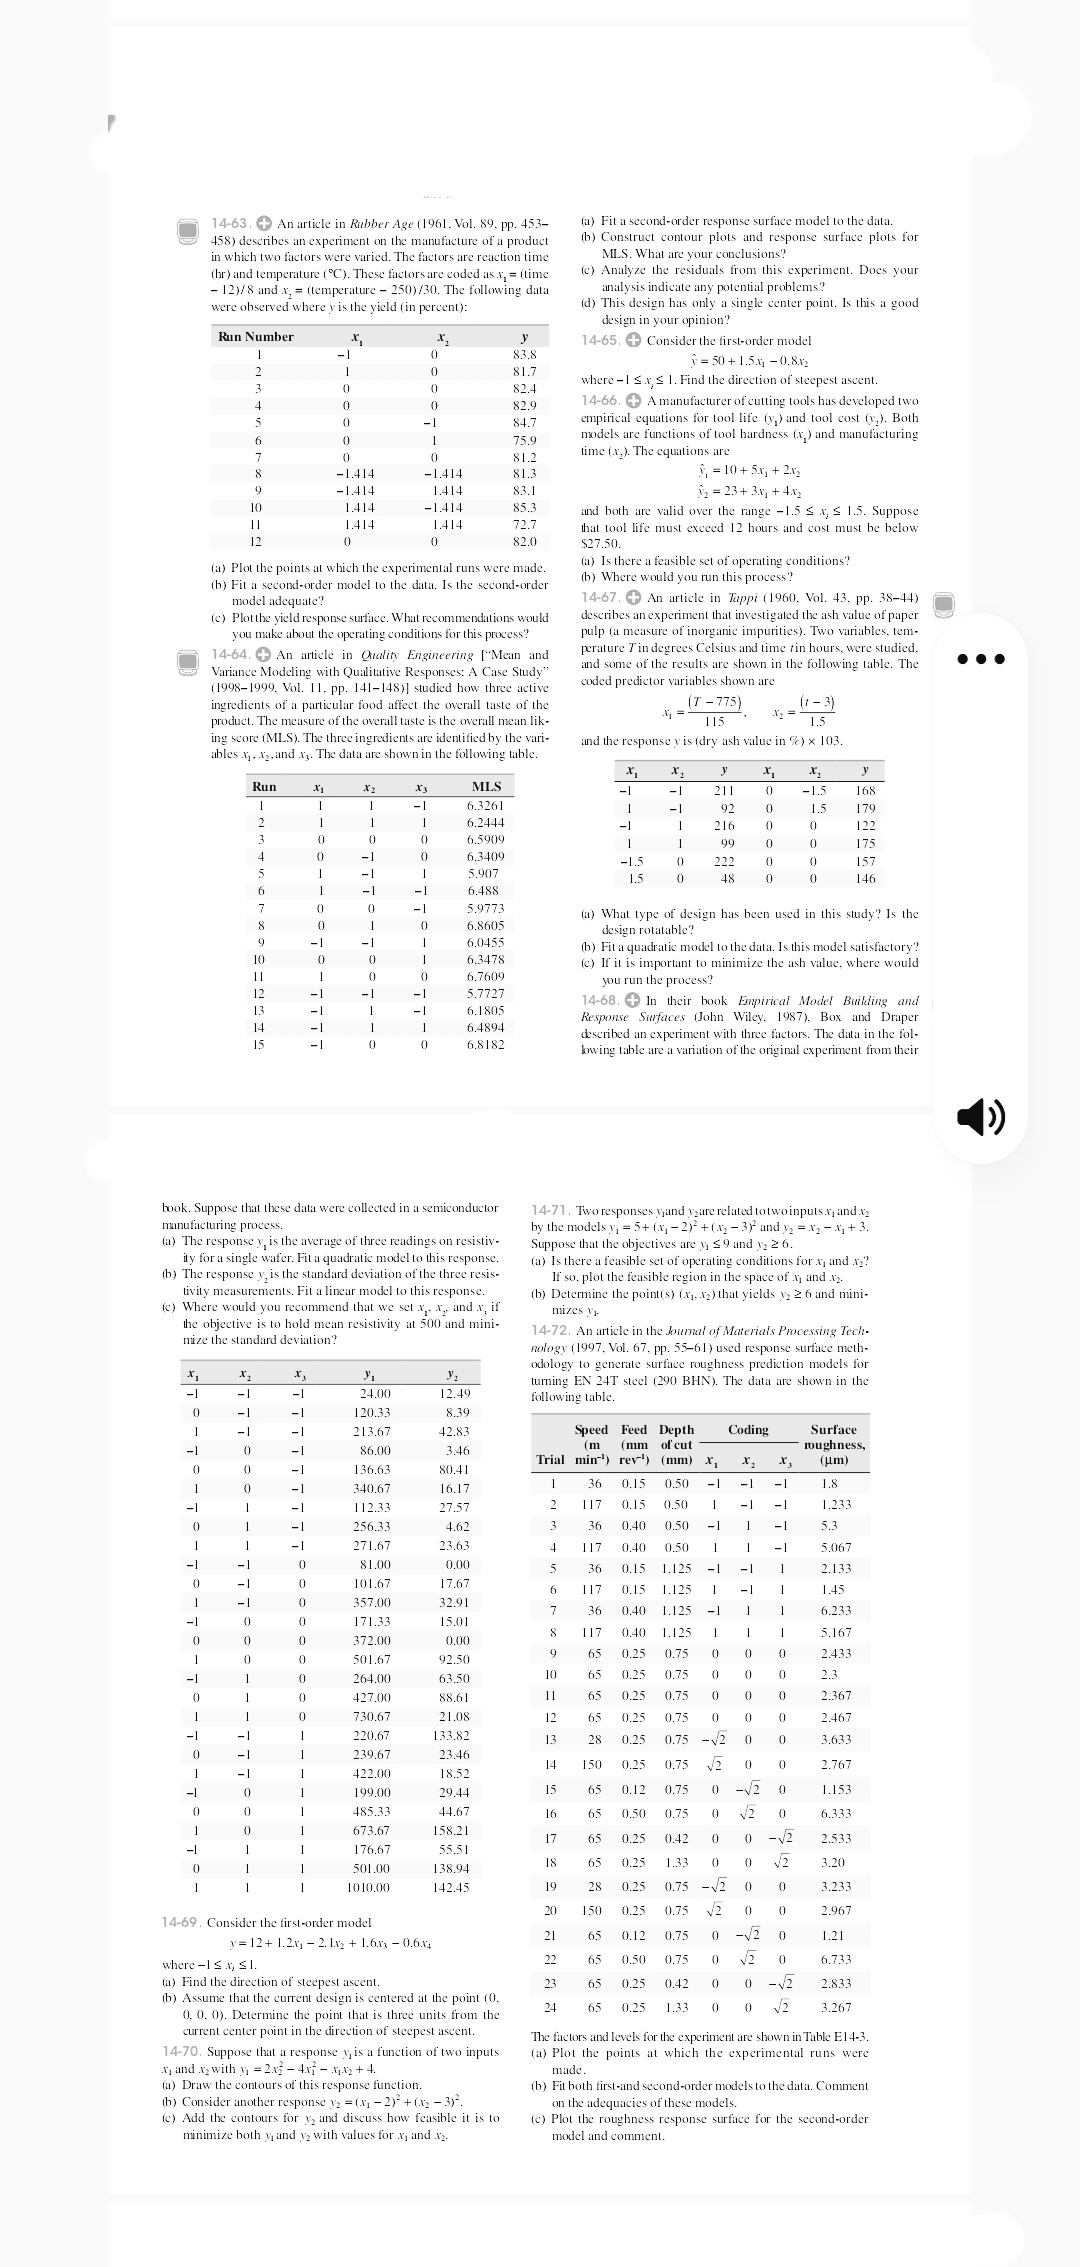
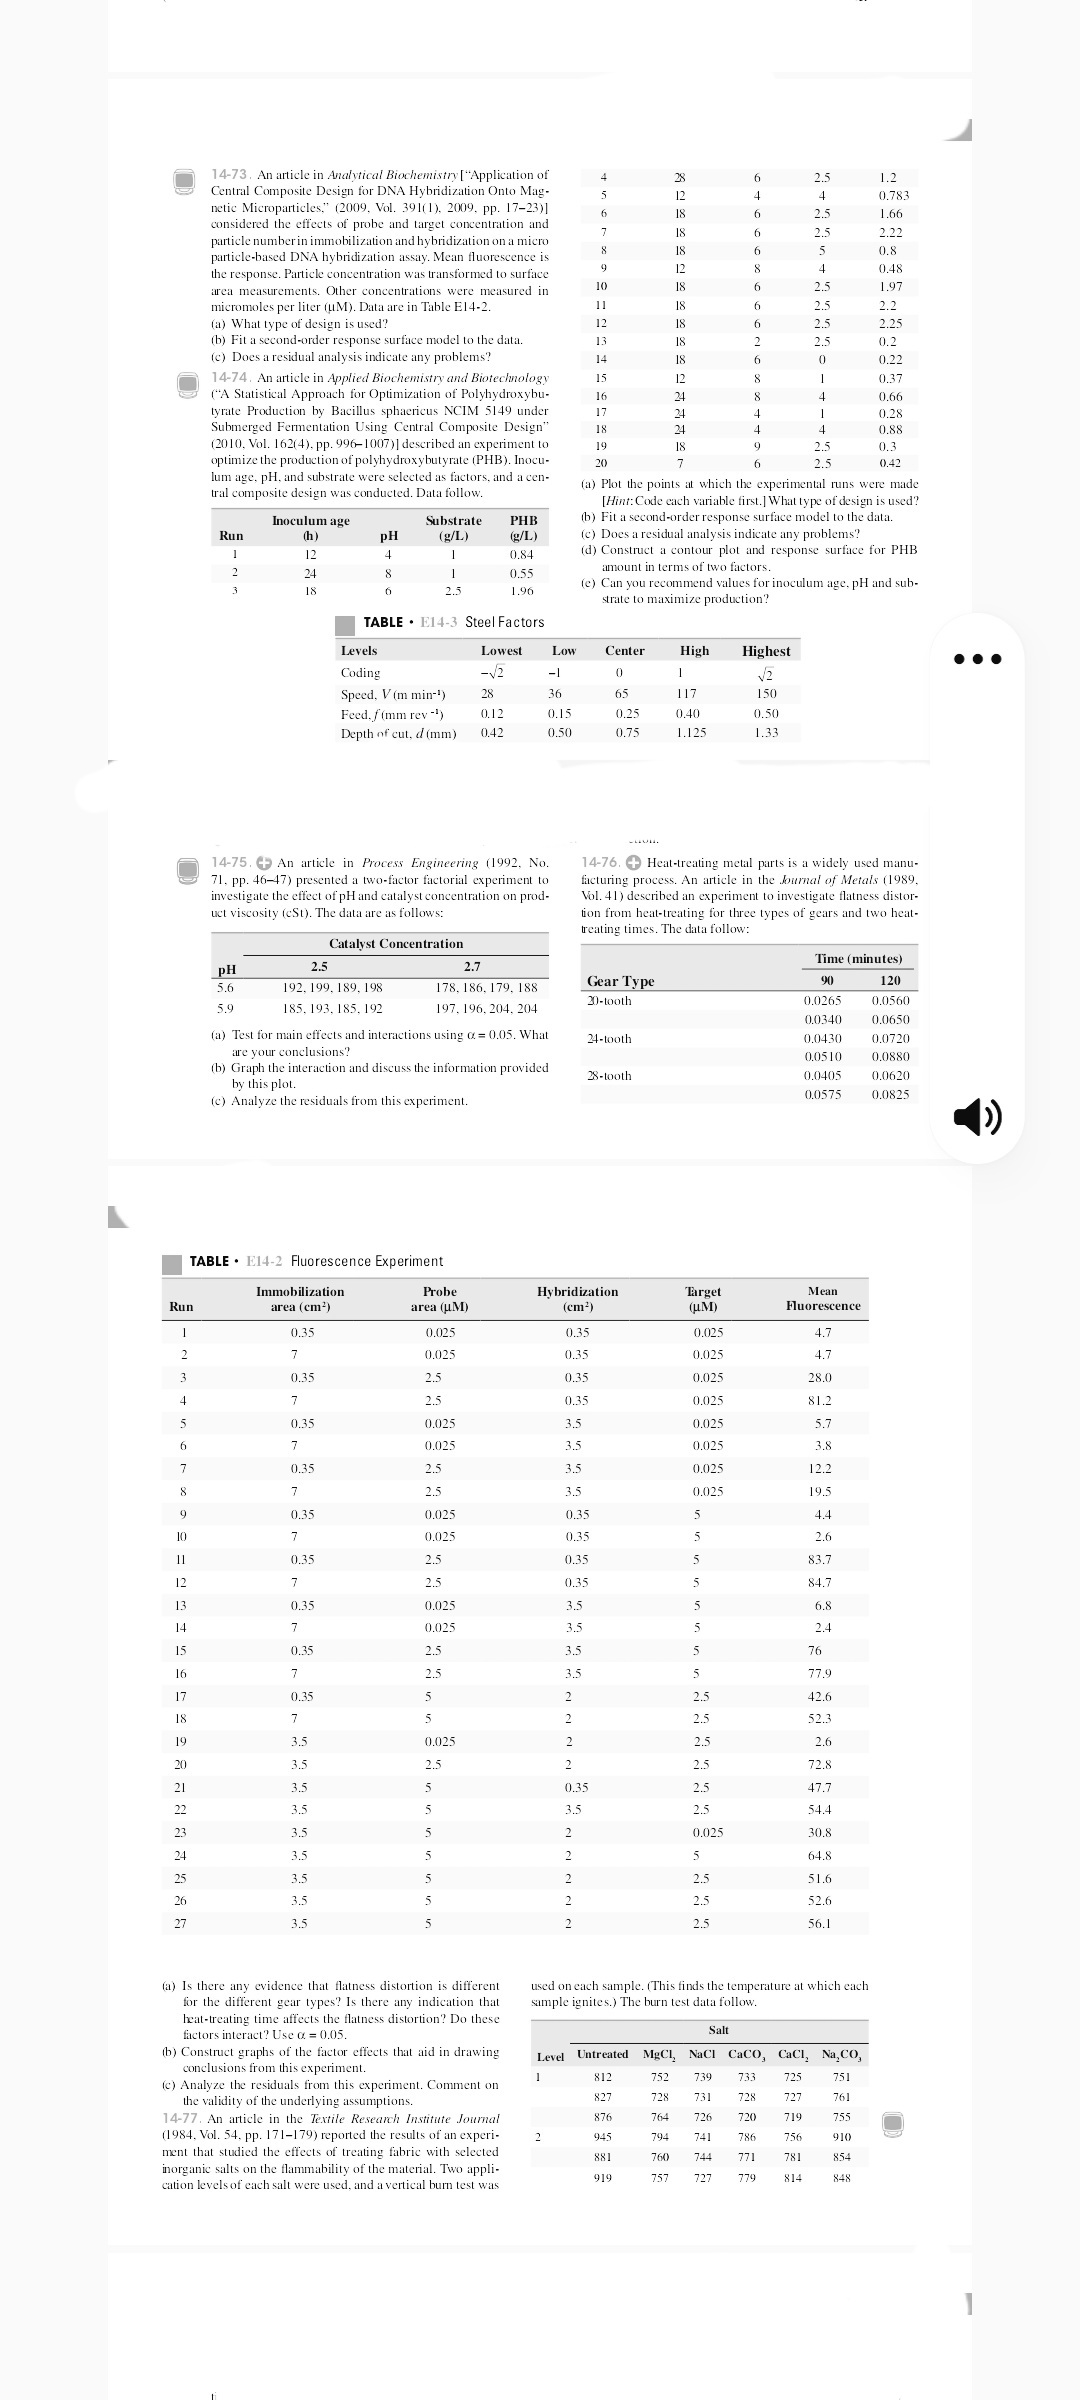
14-63. + An article in Rubber Age (1961. Vol. 89. pp. 453- (a) Fit a second-order response surface model to the data. 458) describes an experiment on the manufacture of a product (b) Construct contour plots and response surface plots for in which two factors were varied. The factors are reaction time MIS. What are your conclusions? (hr ) and temperature ("C). These factors are coded as.y, = (time () Analyze the residuals from this experiment. Does your - 12)/8 and x, = (temperature - 250)/30. The following data analysis indicate any potential problems? were observed where y is the yield (in percent): d) This design has only a single center point. Is this a good design in your opinion? Run Number y 14-65. + Consider the first-order model 83.8 v = 50 + 1.5.x -0.8.X2 81.7 0 82.4 where - 1 S.x, S 1. Find the direction of steepest ascent. 82.9 14-66. + A manufacturer of cutting tools has developed two 0 -L 84.7 empirical equations for tool life (y,) and tool cost (y,). Both 75.9 models are functions of tool hardness (x, ) and manufacturing 0 0 81.2 time (x, ). The equations are -1.414 -1.414 81.3 y, = 10 +5.x, + 2.x2 -1.414 1.414 831 V2 = 23+ 3.x, + 4.x2 10 1.414 -1.414 85.3 and both are valid over the range -1.5 s x, $ 1.5. Suppose 1.414 1.414 72.7 12 that tool life must exceed 12 hours and cost must be below 820 $27.50. (a) Plot the points at which the experimental runs were made. (a) Is there a feasible set of operating conditions? (b) Fit a second-order model to the data. Is the second-order b) Where would you run this process? model adequate? 14-67. + An article in Tappi (1960. Vol. 43. pp. 38-44) (c) Plot the yield response surface. What recommendations would describes an experiment that investigated the ash value of paper you make about the operating conditions for this process? pulp (a measure of inorganic impurities). Two variables, tem- 14-64. + An article in Quality Engineering ["Mean and perature Tin degrees Celsius and time rin hours, were studied, . . . Variance Modeling with Qualitative Responses: A Case Study and some of the results are shown in the following table. The (1998-1999, Vol. 1 1. pp. 141-148)] studied how three active coded predictor variables shown are ingredients of a particular food affect the overall taste of the 17 - 775 product. The measure of the overall taste is the overall mean lik- 12 = _ (1 - 3) 115 1.5 ing score (MLS). The three ingredients are identified by the vari- and the response y is (dry ash value in %) x 103. ables .x, .12, and .x3. The data are shown in the following table. Run X2 MLS 211 -1.5 168 6.3261 92 179 6.2444 216 123 0 0 6.5909 99 175 0 6.3409 222 157 5.907 18 146 6.488 0 5.9773 (a) What type of design has been used in this study? Is the 6.8605 design rotatable? -Otoo 6.045 (b) Fit a quadratic model to the data. Is this model satisfactory? 6.3478 -Lool- ") If it is important to minimize the ash value, where would 6.7609 you run the process? 5.772 6.1805 14-68. + In their book Empirical Model Building and 6.4894 Response Surfaces (John Wiley, 1987). Box and Draper O - 6.8182 described an experiment with three factors. The data in the fol- bowing table are a variation of the original experiment from their book. Suppose that these data were collected in a semiconductor 14-71. Two responses y,and yaare related to two inputs., and.x2 manufacturing process. by the models y, = 5+ (x, - 2) + (x2 - 3) and y? =.12-.x, + 3. (a) The response y, is the average of three readings on resistive Suppose that the objectives are y, $9 and y2 2 6. ity for a single wafer. Fit a quadratic model to this response. a) Is there a feasible set of operating conditions for .y, and .x2? (b) The response y, is the standard deviation of the three resis- If so, plot the feasible region in the space of y, and X2. tivity measurements. Fit a linear model to this response. b) Determine the point(s) (Nj. x2) that yields y2 2 6 and mini- (c) Where would you recommend that we set x x. and x, if mizes y1. he objective is to hold mean resistivity at 500 and mini- mize the standard deviation? 14-72. An article in the Journal of Materials Processing Tech- nology (1997. Vol. 67, pp. 55-61) used response surface meth- odology to generate surface roughness prediction models for turning EN 24T steel (290 BHN). The data are shown in the -1 24.0 2.4 following table. ILL 120.33 8.39 213.67 42.83 peed Feed Depth Coding Surface 86.00 3.46 (m (mm of cut roughness, Trial mind) rev') (mm) x, (um) 136.63 80.41 340.67 16.17 36 0.15 0.50 1.8 1 12.3 27,57 117 0.15 0.50 1.23 256.33 4.6 36 0.40 0.50 5.3 271.67 23.63 4 117 0.40 0.50 5.06 81.00 0,00 5 36 0.15 1.125 2.133 101.67 17.67 6 117 0.15 1.125 1.45 357.00 32.91 7 36 0.40 1.125 6.23 171.33 15.01 8 117 0.40 1.125 5.16 372.00 0,00 501.6 65 0.25 0.75 0 2.432 92.50 264.00 63.50 10 65 0.25 0.75 0 2.3 427.00 88.6 11 65 0.25 0.75 0 2.36 730.67 21.08 12 65 0.25 0.75 0 2.467 220.67 133.82 13 28 0.25 0.75 -V2 0 0 3.633 239.67 23.46 150 0.25 2.76 422.00 14 18.52 0.75 V2 0 199.00 29.44 15 65 0.12 0.75 0 -V2 0 115 485.33 44.67 16 65 0.50 0.75 0 V2 0 6.33 673.67 158.21 17 65 0.25 0.42 0 0 -V2 2.533 176.6 55.51 501.0 18 65 0.25 1.33 0 138.94 0 3.20 1010.00 142.45 19 28 0.25 0.75 -V2 0 0 3.233 20 150 0.25 0.75 V2 0 0 2.967 14-69. Consider the first-order model y= 12+ 1.2x, - 2. 1.x2 + 1.6.x3 - 0.6.x4 21 65 0.12 0.75 -V2 0 1.21 where - 1 S .x, $1. 22 65 0.50 0.75 V2 0 6.73 (a) Find the direction of steepest ascent. 23 65 0.25 0.42 0 - V2 2.83 (b) Assume that the current design is centered at the point (0. 24 65 0.25 0. 0. 0). Determine the point that is three units from the 1.33 3.267 current center point in the direction of steepest ascent. The factors and levels for the experiment are shown in Table E1 4-3. 14-70. Suppose that a response y, is a function of two inputs a) Plot the points at which the experimental runs were v, and .12 with y = 2.x7 - 4.xj - .Mj-12 + 4. made. (a) Draw the contours of this response function. (b) Fit both first-and second-order models to the data. Comment (b) Consider another response y? = (x] - 2) + (.x2 - 3). on the adequacyes of these models. c) Add the contours for y, and discuss how feasible it is to c) Plot the roughness response surface for the second-order minimize both y and y2 with values for .x, and x2. model and comment.14-73. An article in Analytical Biochemistry ["Application of .2 Central Composite Design for DNA Hybridization Onto Mag- 0.78 netic Microparticles." (2009. Vol. 391(1). 2009. pp. 17-23)1 considered the effects of probe and target concentration and .66 particle number in immobilization and hybridization on a micro particle-based DNA hybridization assay. Mean fluorescence is 0.8 the response. Particle concentration was transformed to surface 0.4 area measurements. Other concentrations were measured in 19 micromoles per liter (UM). Data are in Table E14-2. 2.2 (a) What type of design is used? 2.25 (b) Fit a second-order response surface model to the data. (c) Does a residual analysis indicate any problems? 18 6 0.22 14-74. An article in Applied Biochemistry and Biotechnology 12 0 37 "A Statistical Approach for Optimization of Polyhydroxybu- 24 8 0.66 tyrate Production by Bacillus sphaericus NCIM 5149 under 0.28 Submerged Fermentation Using Central Composite Design" 18 24 0.88 2010, Vol. 162(4). pp. 996-1007) ] described an experiment to 19 18 2.5 0.3 optimize the production of polyhydroxybutyrate (PHB). Inocu- 20 25 0.42 lum age, PH. and substrate were selected as factors, and a cen- tral composite design was conducted. Data follow. (a) Plot the points at which the experimental runs were made [Hint: Code each variable first. | What type of design is used? Inoculum age Substrate PHB (b) Fit a second-order response surface model to the data. Run (h) PH (g/L) (2/L) (c) Does a residual analysis indicate any problems? 0.84 (d) Construct a contour plot and response surface for PHB 0 0 + 0.55 amount in terms of two factors. 1.96 (e) Can you recommend values for inoculum age, pH and sub- strate to maximize production? TABLE . E14-3 Steel Factors Level Lowest Low Center High Highest . . . Coding -V2 -1 V2 Speed, V (m min-') 28 36 65 117 150 Feed. f(mm rev -!) 0.12 0.15 0.25 0.40 0.50 Depth of cut, d (mm) 042 050 0 75 1.125 1.33 -LAUM. 14-75. F An article in Process Engineering (1992. No. 14-76. + Heat-treating metal parts is a widely used manu- 71. pp. 46-47) presented a two-factor factorial experiment to facturing process. An article in the Journal of Metals (1989. investigate the effect of pH and catalyst concentration on prod- Vol. 41) described an experiment to investigate flatness distor- uct viscosity (cSt). The data are as follows: tion from heat-treating for three types of gears and two heat- treating times. The data follow: Catalyst Concentration 2.5 2.7 Time (minutes) PH 5.6 192. 199, 189, 198 78. 186. 179, 188 Gear Type 120 50 185, 193. 185, 192 197. 196. 204. 204 20-tooth 0.0265 0.0560 0.0340 0.0650 a) Test for main effects and interactions using a = 0.05. What 24-tooth 0.0430 0.0720 are your conclusions? 0.0510 b) Graph the interaction and discuss the information provided 0.0880 0.0620 by this plot. 28-tooth 0.0405 (c) Analyze the residuals from this experiment. 0.0575 0.0825 TABLE . E14-2 Fluorescence Experiment Immobilization Probe Hybridization Target Mean Run area (cm') area (UM) (em') (UM) Fluorescence 0.35 0.02 0.3 0.025 4.7 0.025 0.35 0.025 4.7 03 2.5 0.35 0.025 28.0 7 25 10 Vit W IN 0.35 0.025 81.2 0.35 0.025 3.5 0.025 5.7 7 0.02 3.5 0.025 3.8 0.35 2.5 3.5 0.025 12.2 7 25 35 0.025 19.5 0.35 0.025 0 35 4.4 7 0.025 0.35 2.6 0.35 2.5 0.35 83.7 7 2.5 0.35 84.7 0.35 0.025 3.5 6.8 7 0.02 3.5 2.4 0.35 2.5 3.5 76 3.5 77.9 0.35 2.5 42.6 2.5 52.3 NNNN 0.025 2.5 2.6 2.5 2.5 72.8 0.3 2.5 17.7 3.5 3.5 25 54.4 3.5 0.025 30.8 64.8 NNNNN 2.5 51.6 3.5 2.5 52.6 3.5 25 561 (a) Is there any evidence that flatness distortion is different used on each sample. (This finds the temperature at which each for the different gear types? Is there any indication that sample ignites.) The burn test data follow. heat-treating time affects the flatness distortion? Do these factors interact? Use a = 0.05. (b) Construct graphs of the factor effects that aid in drawing Level Untreated MgCl, NaCI CaCO, CaCl, Na, CO, conclusions from this experiment. 1 (c) Analyze the residuals from this experiment. Comment on 312 752 739 733 725 751 the validity of the underlying assumptions. 27 728 731 728 727 761 14-77. An article in the Textile Research Institute Journal 376 764 726 720 719 755 (1984. Vol. 54. pp. 171-179) reported the results of an experi- 945 794 741 786 756 910 ment that studied the effects of treating fabric with selected 881 760 744 771 781 854 inorganic salts on the flammability of the material. Two appli- 919 757 727 779 814 cation levels of each salt were used, and a vertical burn test was


