Answered step by step
Verified Expert Solution
Link Copied!

Question

1 Approved Answer

please help 15. Test the claim below about the mean of the differences for a population of paired data at the level of significance a.

please help
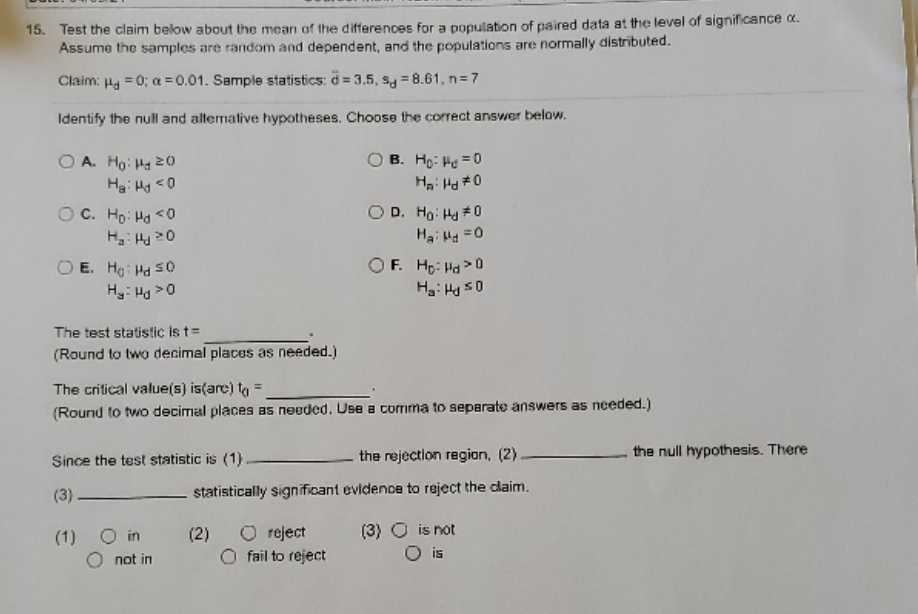
image text in transcribed
15. Test the claim below about the mean of the differences for a population of paired data at the level of significance a. Assume the samples are random and dependent, and the populations are normally distributed. Claim: Hy =0; a =0.01. Sample statistics: d = 3.5, 3d = 8.61, n= 7 Identify the null and alternative hypotheses. Choose the correct answer below. O A. Hgilly 20 O B. HD: He =0 Ha: Hd # 0 O C. HD: Hg 0 Hy : Hu >0 The test statistic is t= (Round to two decimal places as needed.) The critical value(s) is(are) to = (Round to two decimal places as needed. Use a corrima to separate answers as needed.) Since the test statistic is (1) the rejection region, (2) the null hypothesis. There (3) statistically significant evidence to reject the claim. (1) O in (2) O reject (3) O is not O not in O fail to reject is

Step by Step Solution

There are 3 Steps involved in it

Step: 1

blur-text-image

Get Instant Access to Expert-Tailored Solutions

See step-by-step solutions with expert insights and AI powered tools for academic success

Step: 2

blur-text-image

Step: 3

blur-text-image

Ace Your Homework with AI

Get the answers you need in no time with our AI-driven, step-by-step assistance

Get Started

Recommended Textbook for

An Introduction to the Mathematics of financial Derivatives

Authors: Salih N. Neftci

2nd Edition

978-0125153928, 9780080478647, 125153929, 978-0123846822

More Books

Students also viewed these Mathematics questions