

Answered step by step
Verified Expert Solution
Question
1 Approved Answer
please help 3 Alimentation Couche-Tard Inc. is a leading convenience store operator in Canada, with Couche-Tard stores in stores in central and western Canada. It
please help 3
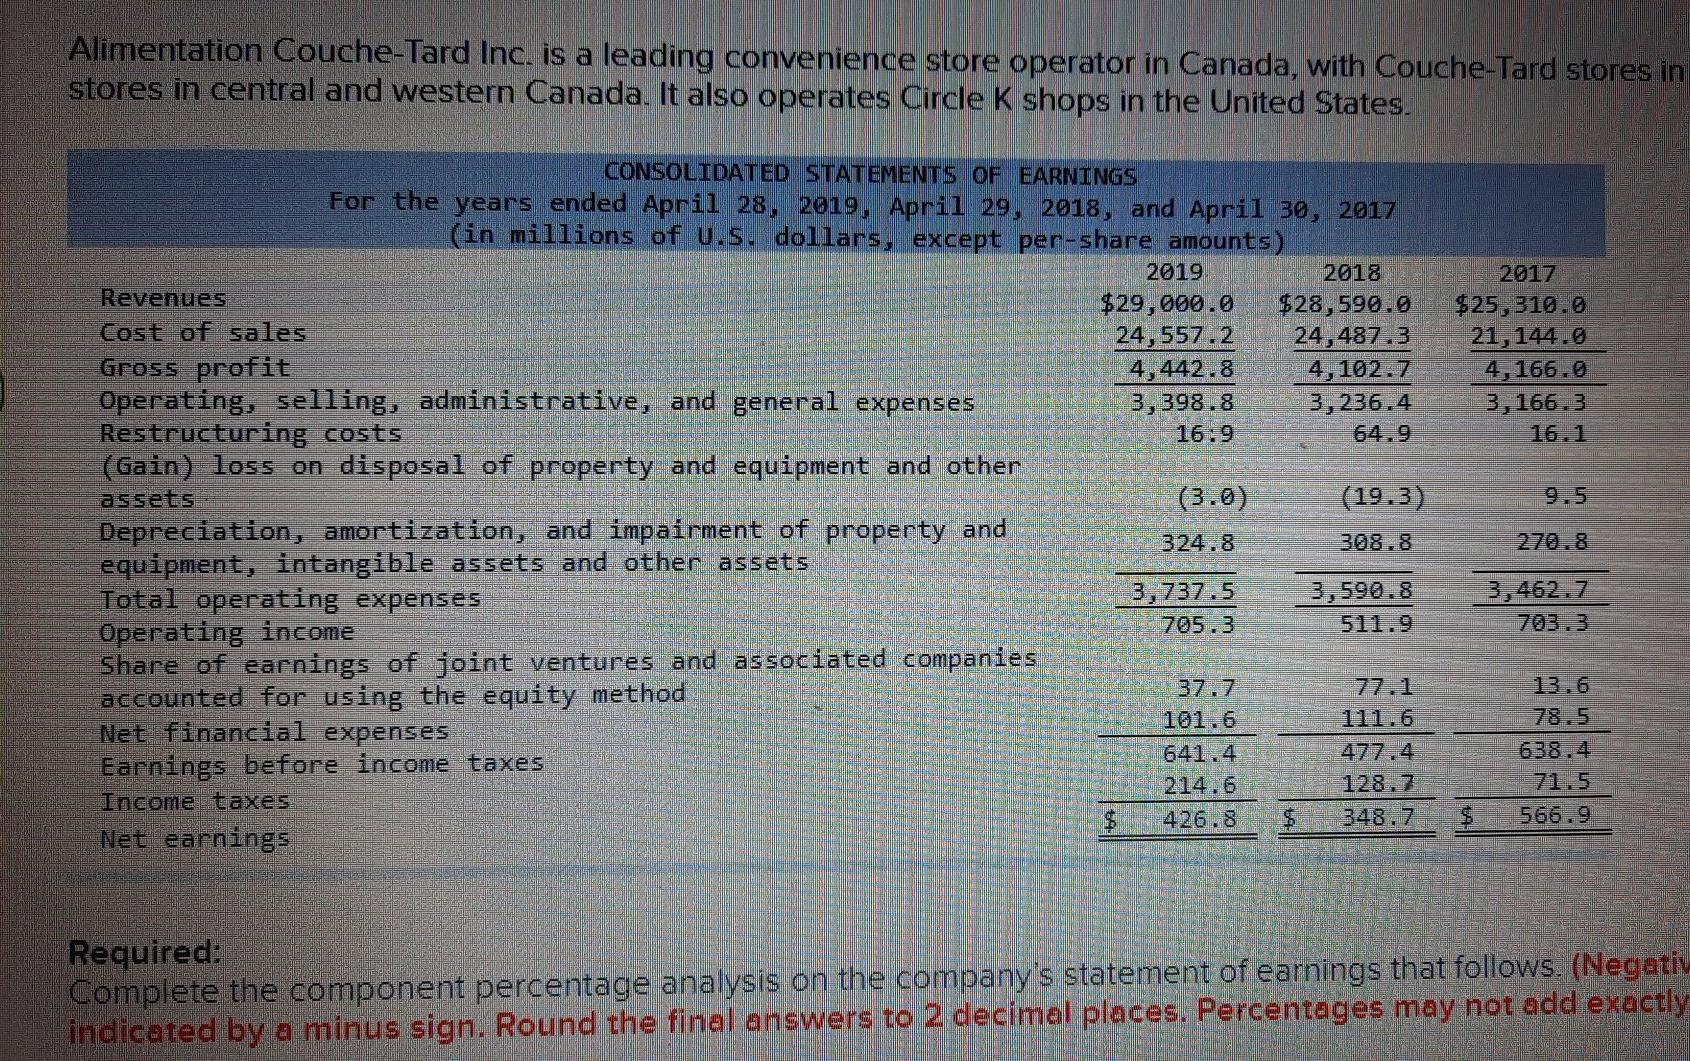
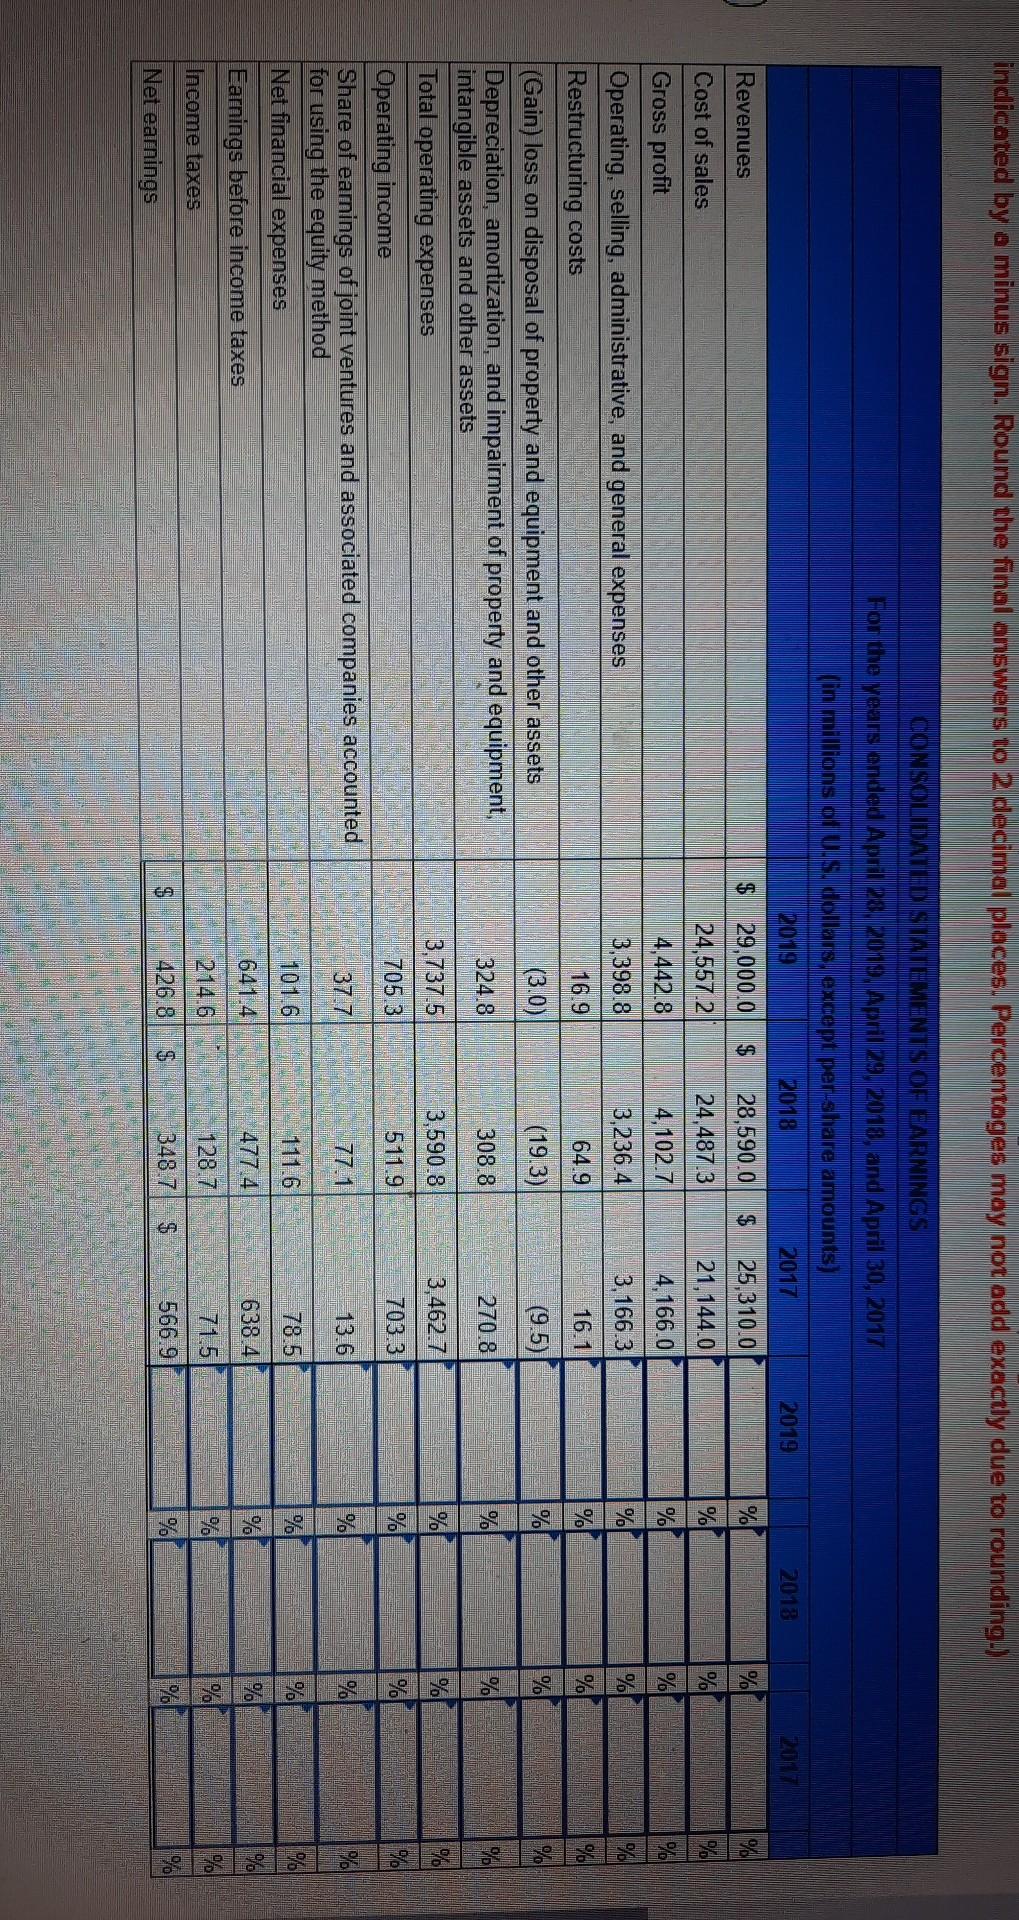
Alimentation Couche-Tard Inc. is a leading convenience store operator in Canada, with Couche-Tard stores in stores in central and western Canada. It also operates Circle K shops in the United States. CONSOLIDATED STATEMENTS OF EARNINGS For the years ended April 28, 2019, April 29, 2018, and April 30, 2017 (in millions of U.S. dollars, except per-share amounts) 2019 2018 2017 Revenues $29,000.0 $28,590.0 $25,310.0 Cost of sales 24,557.2 24,487.3 21, 144.0 Gross profit 4,442.8 4, 102.7 4,166.0 Operating, selling, administrative, and general expenses 3,398.8 3,236.4 3, 166.3 Restructuring costs 16:9 64.9 16.1 (Gain) loss on disposal of property and equipment and other assets (3.0) (19.3) 9.5 Depreciation, amortization, and impairment of property and 324.8 308.8 270.8 equipment, intangible assets and other assets Total operating expenses 3,737.5 3,590.8 3,462.7 705.3 Operating income 511.9 7033 Share of earnings of joint ventures and associated companies 77.1 13.6 accounted for using the equity method Net financial expenses 101.6 1116 78.5 641.4 477.4 638.4 Earnings before income taxes 214.6 71.5 Income taxes. $ 426.8 348.7 $ 566.9 Net earnings Required: Complete the component percentage analysis on the company's statement of earnings that follows. (Negativ indicated by a minus sign. Round the final answers to 2 decimal places. Percentages may not add exactly indicated by a minus sign. Round the final answers to 2 decimal places. Percentages may not add exactly due to rounding.) 2019 2018 2017 % % % Po % % % % % % 90 CONSOLID STATEMENTS OF FARNINGS For the years onded April 20 2013 April 29, 2014, and April 30, 2017 (in millions of U.S. dollars, except per-share amounts) 2019 2018 2017 Revenues $ 29,000.0 $ 28,590.0 $ 25,310.0 Cost of sales 24,5572 24.487.3 21,144.0 Gross profit 4,442.8 4,102.7 4,166.0 Operating, selling, administrative, and general expenses 3,398.8 3,236.4 3,166.3 Restructuring costs 16.9 64.9 16.1 (Gain) loss on disposal of property and equipment and other assets (3.0) (19.3) (9.5) Depreciation, amortization, and impairment of property and equipment, 324.8 308.8 270.8 intangible assets and other assets Total operating expenses 3,737.5 3,590.8 3,462.7 705.3 511.9 703.3 Operating income Share of earnings of joint ventures and associated companies accounted 37.7 77.1 13.6 for using the equity method Net financial expenses 101.6 111.6 78.5 641.4 477.4 638.4 Earnings before income taxes 214.6 128.7 71.5 Income taxes 426.8 348.7 $ 566.9 Net earnings % % % % % % % %1 % % % % % % % % % % % $ % %Step by Step Solution
There are 3 Steps involved in it
Step: 1

Get Instant Access to Expert-Tailored Solutions
See step-by-step solutions with expert insights and AI powered tools for academic success
Step: 2

Step: 3
Ace Your Homework with AI
Get the answers you need in no time with our AI-driven, step-by-step assistance
Get Started
Information Systems Audit In Banking Sector A Study Of SBI And ICICI Banks
Authors: C. Mallesha, M. Sulochana
1st Edition
6200254397, 978-6200254399