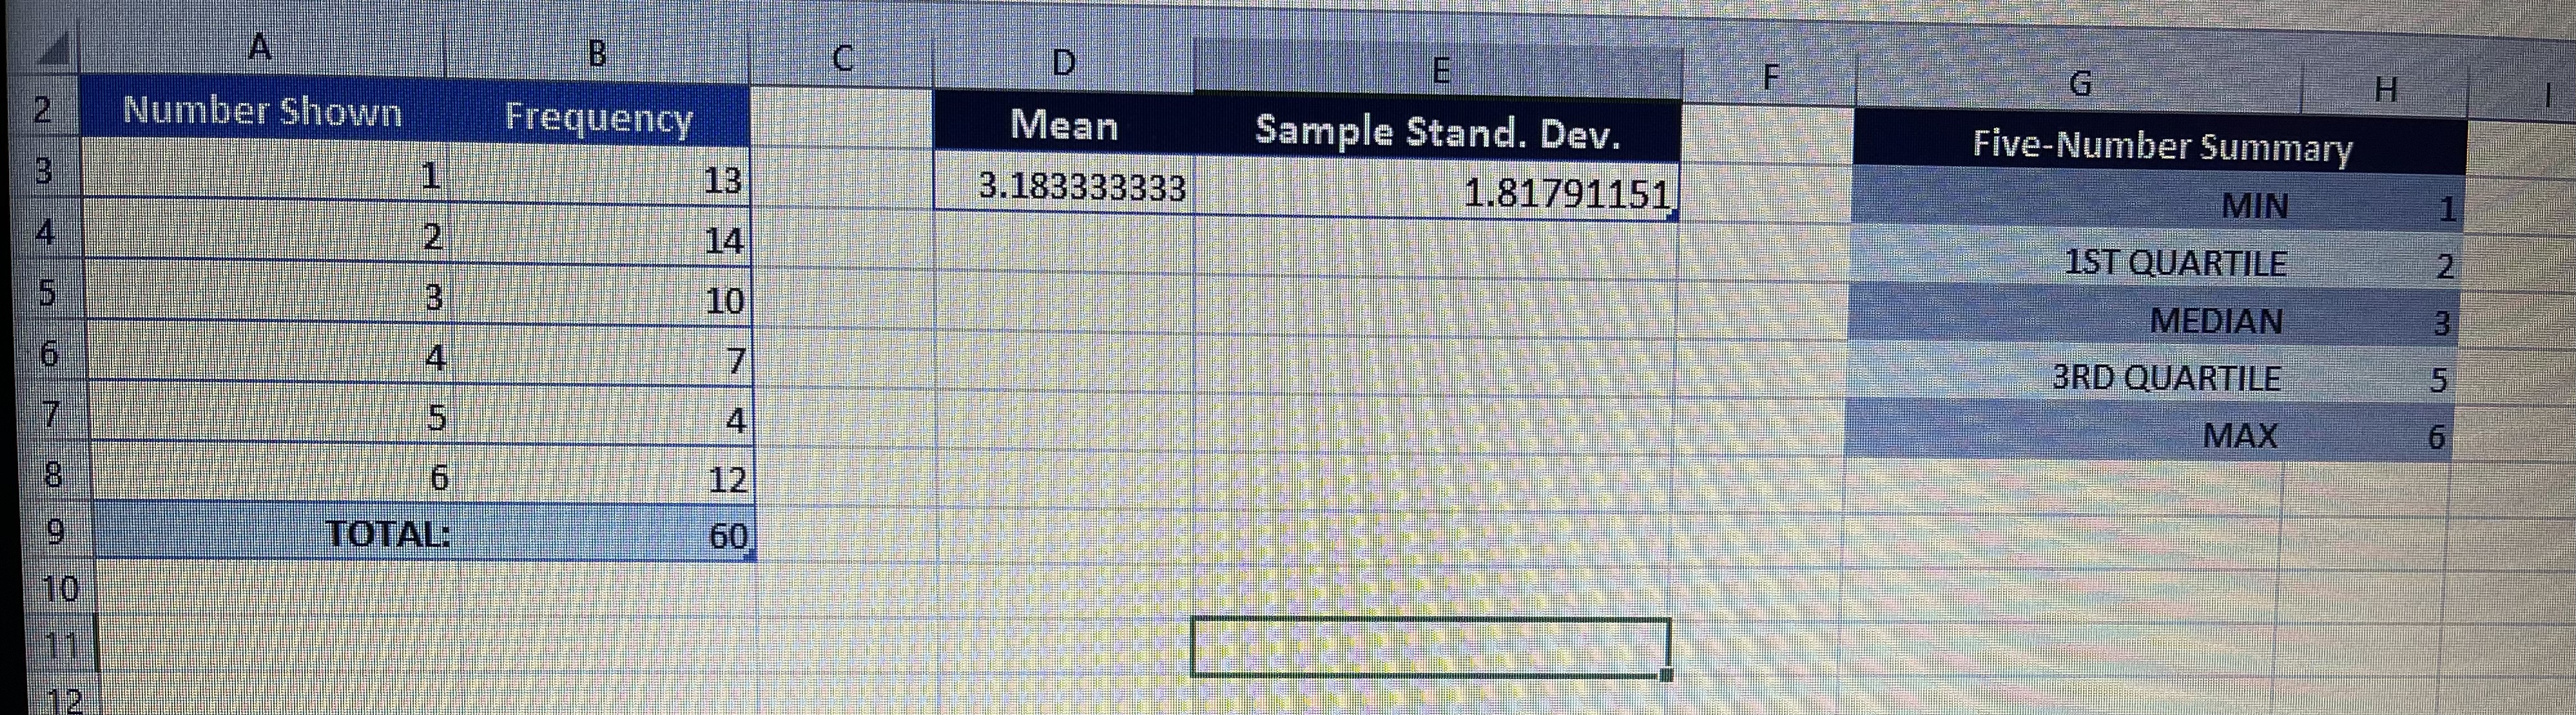
Please help! A B D E G H Number Shown Frequency Mean Sample Stand. Dev. Five-Number Summary 13 3.183333333 1.81791151 MIN 14 1ST QUARTILE 10
Please help!
A B D E G H Number Shown Frequency Mean Sample Stand. Dev. Five-Number Summary 13 3.183333333 1.81791151 MIN 14 1ST QUARTILE 10 MEDIAN 7 3RD QUARTILE 4 MAX 12 TOTAL: 60 10The third tab should be labeled \"Hypothesis Test\". In this tab, you must perform a Pearson's xz-test for goodness of t, under the null hypothesis (Ho) that your die is fair, with a level of signicance of a = 0.01. This tab must include each of the following four (4) items: 1. A small text box titled \"Null & Alternative Hypotheses\MATH 2110 PROJECT STAGE III - PEARSON'S X2-TEST FOR GOODNESS OF FIT Throughout the remainder of this semester, you will be conducting an experiment and corresponding statistical analyses to determine whether or not a specific standard six-sided die is fair. I- II(a) - II(b) - III - IV The purpose of this project is for you to get some hands-on experience at data collection, organization, and presentation, and the statistical analysis of data. This project will be done in multiple stages; this is the third stage. In this stage, you will perform a Pearson's x2-test for goodness of fit using the data that you collected in Stage I. (NOTE THAT YOU ARE NOT REQUIRED TO COLLECT A NEW SAMPLE OF DATA FOR THIS STAGE. YOU SHOULD REUSE THE RAW DATA THAT YOU COLLECTED IN STAGE I.) In order to complete this stage of the project, you must first recall the raw data that you collected in Stage I. You will need to reorganize your data into a new, third Excel spreadsheet for submission. Please be sure to name your new Excel file using the following format: LASTNAME_FIRSTINITIAL_MATH_2110_PROJECT_STAGE_III . xIsx This Excel spreadsheet that you will submit should contain four (4) tabs for the purpose of data organization. The first tab of your Excel file should be labeled "Raw Data", and it must include the raw data that you collected for Stage I, organized into a table. Again, for emphasis, you need not collect a new set of data for this stage of the project. The second tab should be labeled "Frequency Distribution". Using Excel's COUNTIF function and your raw data (see above), you must include a frequency distribution table counting the numbers of Is, 2s, 3s, 4s, 5s, and 6s that you rolled. Clearly and unambiguously label your frequency distribution table "Observed Frequencies". (It might be prudent for you to revisit your Stage I submission for this tab.) N The third tab should be labeled "Hypothesis Test". In this tab, you must perform a Pearson's x"-test for goodness of fit, under the null hypothesis (Ho) that your die is fair, with a level of significance of a = 0.01. This tab must include each of the following four (4) items: 1. A small text box titled "Null & Alternative Hypotheses", in which the null and alternative hypotheses are explicitly stated. The title should appear in the first line of the
Step by Step Solution
There are 3 Steps involved in it
Step: 1
Get Instant Access to Expert-Tailored Solutions
See step-by-step solutions with expert insights and AI powered tools for academic success
Step: 2
Step: 3
Ace Your Homework with AI
Get the answers you need in no time with our AI-driven, step-by-step assistance