Answered step by step
Verified Expert Solution
Link Copied!

Question

1 Approved Answer

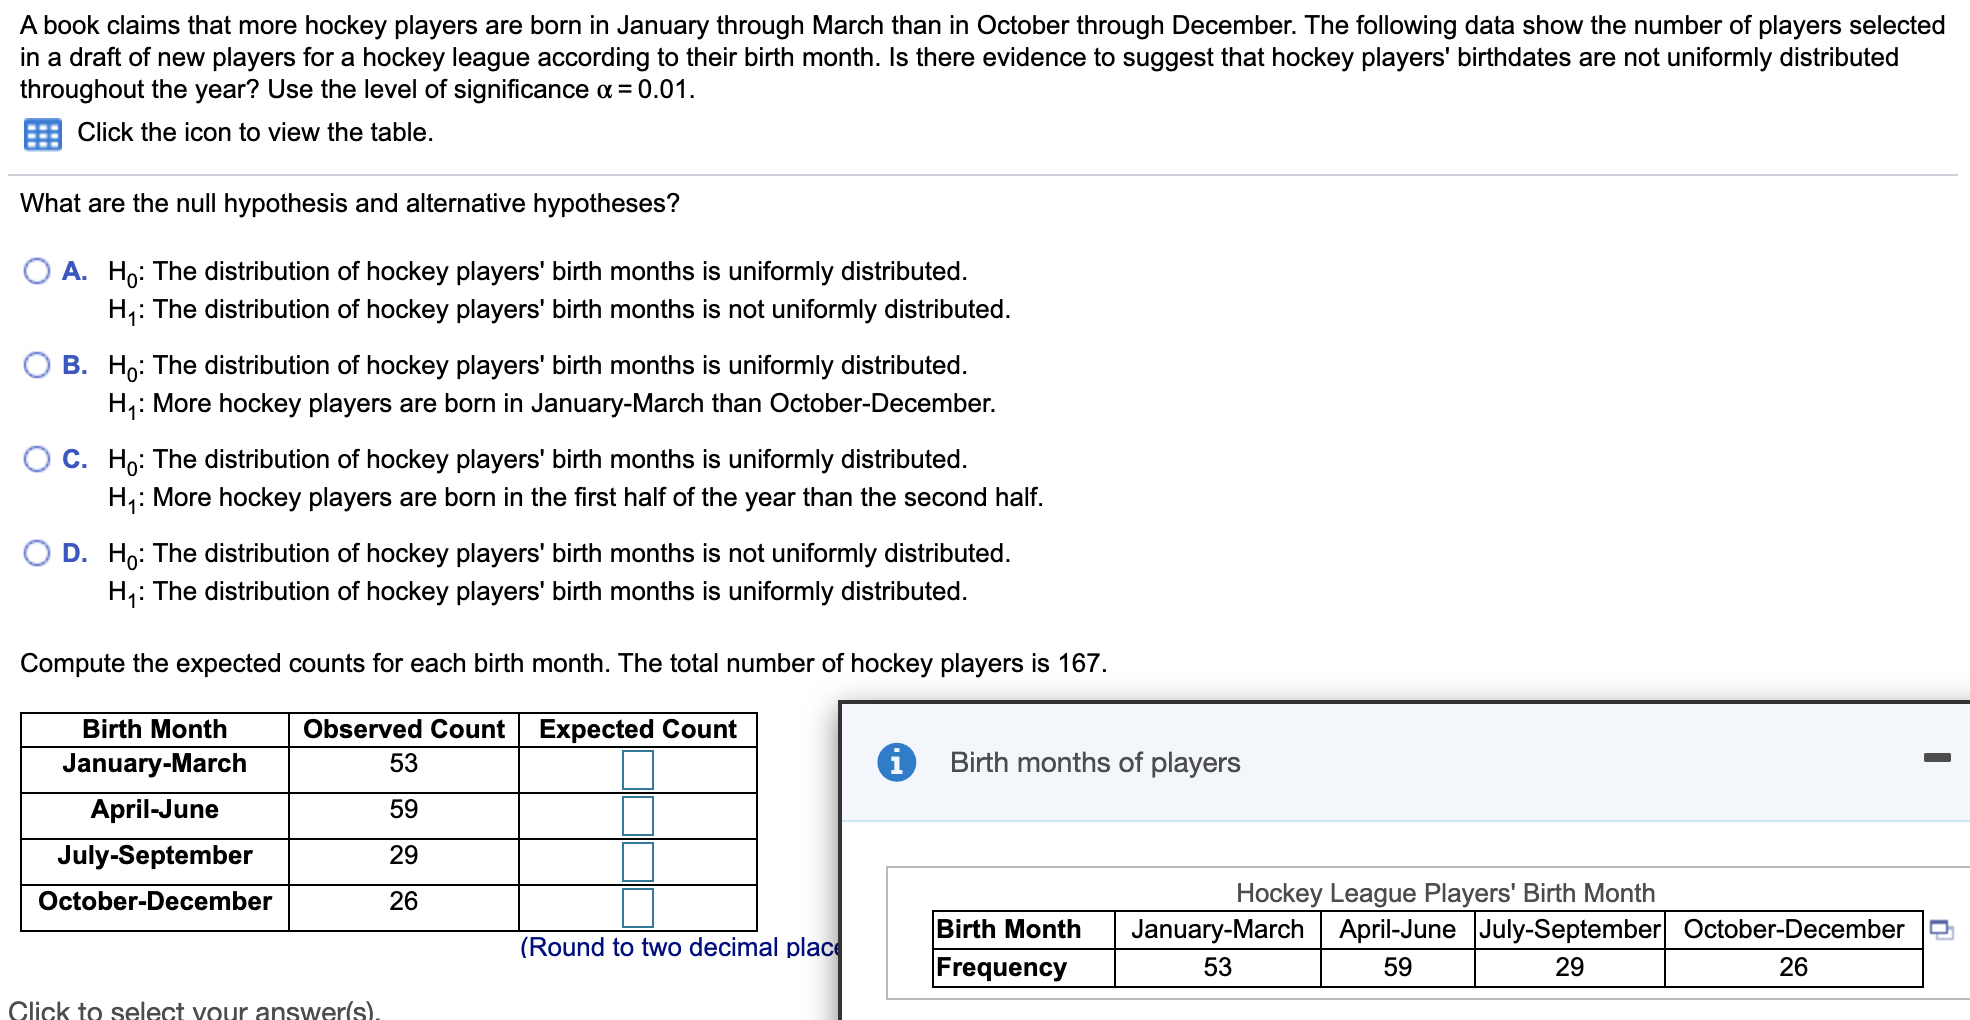
please help A book claims that more hockey players are born in January through March than in October through December. The following data show the

please help

image text in transcribedimage text in transcribed
A book claims that more hockey players are born in January through March than in October through December. The following data show the number of players selected in a draft of new players for a hockey league according to their birth month. Is there evidence to suggest that hockey players' birthdates are not uniformly distributed throughout the year? Use the level of significance a = 0.01. Click the icon to view the table. What are the null hypothesis and alternative hypotheses? O A. Ho: The distribution of hockey players' birth months is uniformly distributed. H,: The distribution of hockey players' birth months is not uniformly distributed. O B. Ho: The distribution of hockey players' birth months is uniformly distributed. Hy: More hockey players are born in January-March than October-December. O C. Ho: The distribution of hockey players' birth months is uniformly distributed. Hy: More hockey players are born in the first half of the year than the second half. O D. Ho: The distribution of hockey players' birth months is not uniformly distributed. H,: The distribution of hockey players' birth months is uniformly distributed. Compute the expected counts for each birth month. The total number of hockey players is 167. Birth Month Observed Count Expected Count January-March 53 Birth months of players April-June 59 July-September 29 October-December 26 Hockey League Players' Birth Month Birth Month (Round to two decimal place January-March April-June July-September October-December Frequency 53 59 29 26 (s)What is the test statistic? = (Round to three decimal places as needed.) What is the P-value of the test? P-value = (Round to three decimal places as needed.) Based on the results, do the hockey league's players' birth months follow a uniform distribution? Use the level of significance a = 0.01. O A. No, because the calculated P-value is greater than the given a level of significance. O B. No, because the calculated P-value is less than the given a level of significance. O c. Yes, because the calculated P-value is greater than the given a level of significance. O D. Yes, because the calculated P-value is less than the given a level of significance

Step by Step Solution

There are 3 Steps involved in it

Step: 1

blur-text-image

Get Instant Access to Expert-Tailored Solutions

See step-by-step solutions with expert insights and AI powered tools for academic success

Step: 2

blur-text-image

Step: 3

blur-text-image

Ace Your Homework with AI

Get the answers you need in no time with our AI-driven, step-by-step assistance

Get Started

Recommended Textbook for

Fundamentals Of Business Mathematics In Canada

Authors: F. Ernest Jerome, Jackie Shemko

3rd Edition

1259370151, 978-1259370151

More Books

Students also viewed these Mathematics questions