Please help! A major client of your company is interested in the salary distributions of jobs in the state of Minnesota that range from $30,000
Please help!
A major client of your company is interested in the salary distributions of jobs in the state of Minnesota that range from $30,000 to $200,000 per year. As a Business Analyst, your boss asks you to research and analyze the salary distributions. You are given a spreadsheet that contains the following information:
A listing of the jobs by title
The salary (in dollars) for each job
Instructions
The data set in the spreadsheet consists of 599 records that you will be analyzing from the Bureau of Labor Statistics. The data set contains a listing of several job titles with yearly salaries ranging from approximately $30,000 to $200,000 for the state of Minnesota.
The Excel spreadsheet contains six tabs. The first tab, labeled "data," requires you to calculate the mean, standard deviation, and sample size using the correct Excel formulas. The next five tabs contain questions to complete. Ensure completely answer all questions with the steps shown, explanations, and correct formatting.
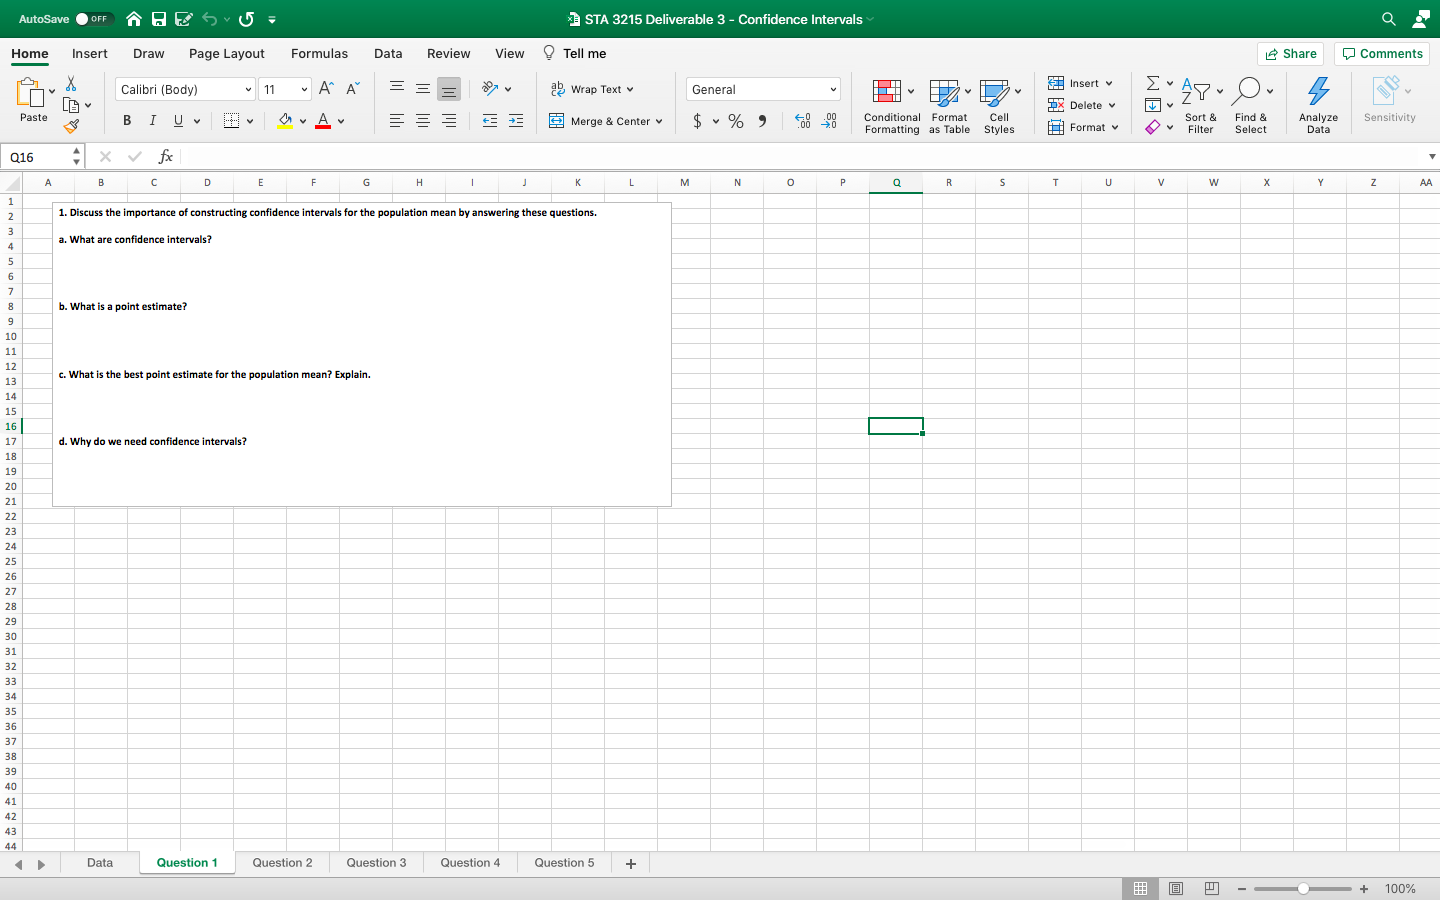
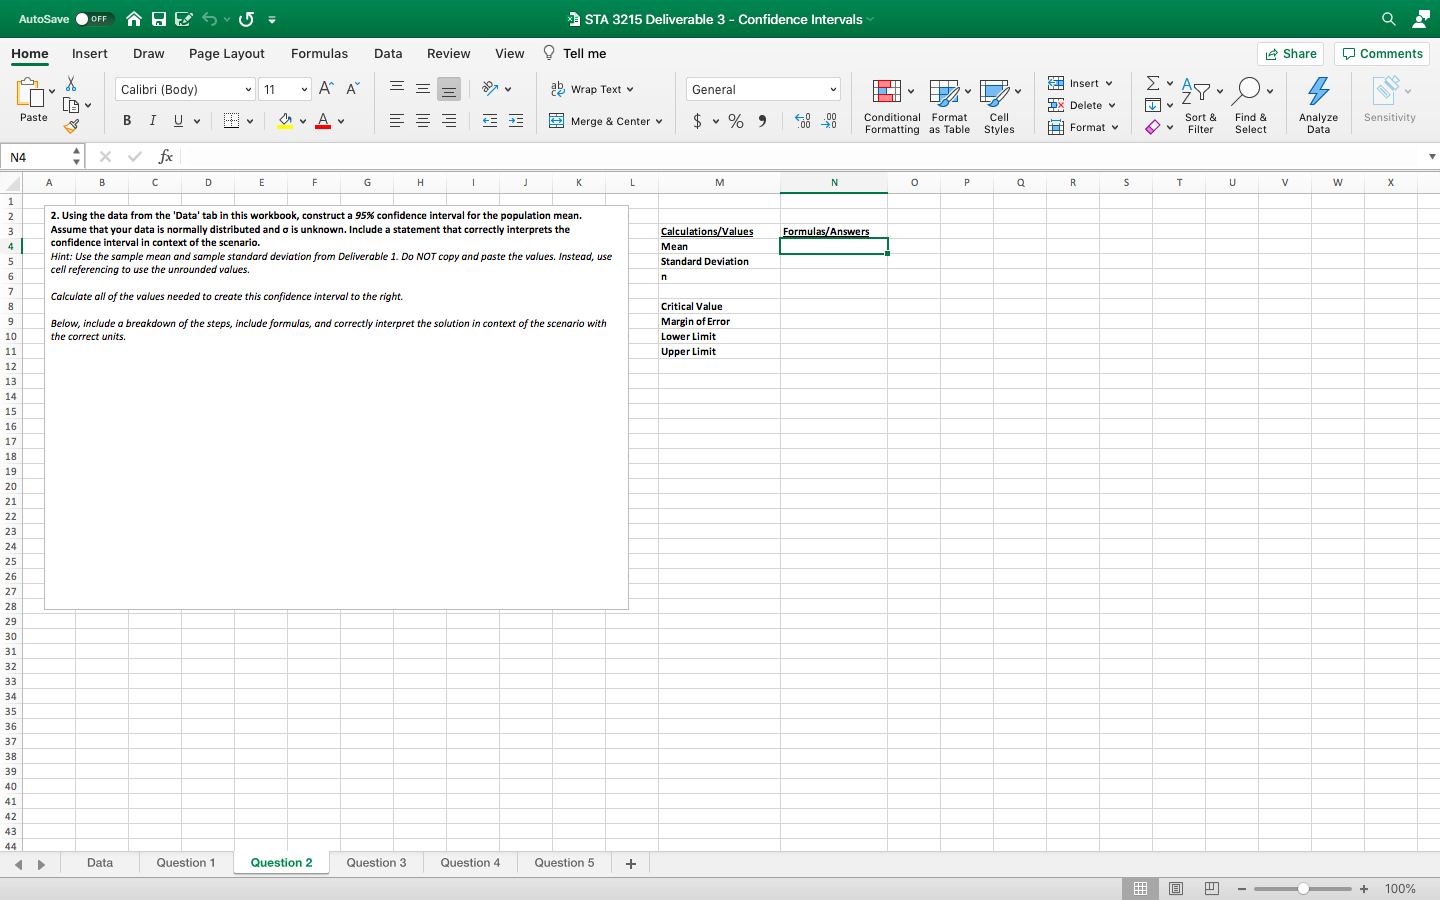
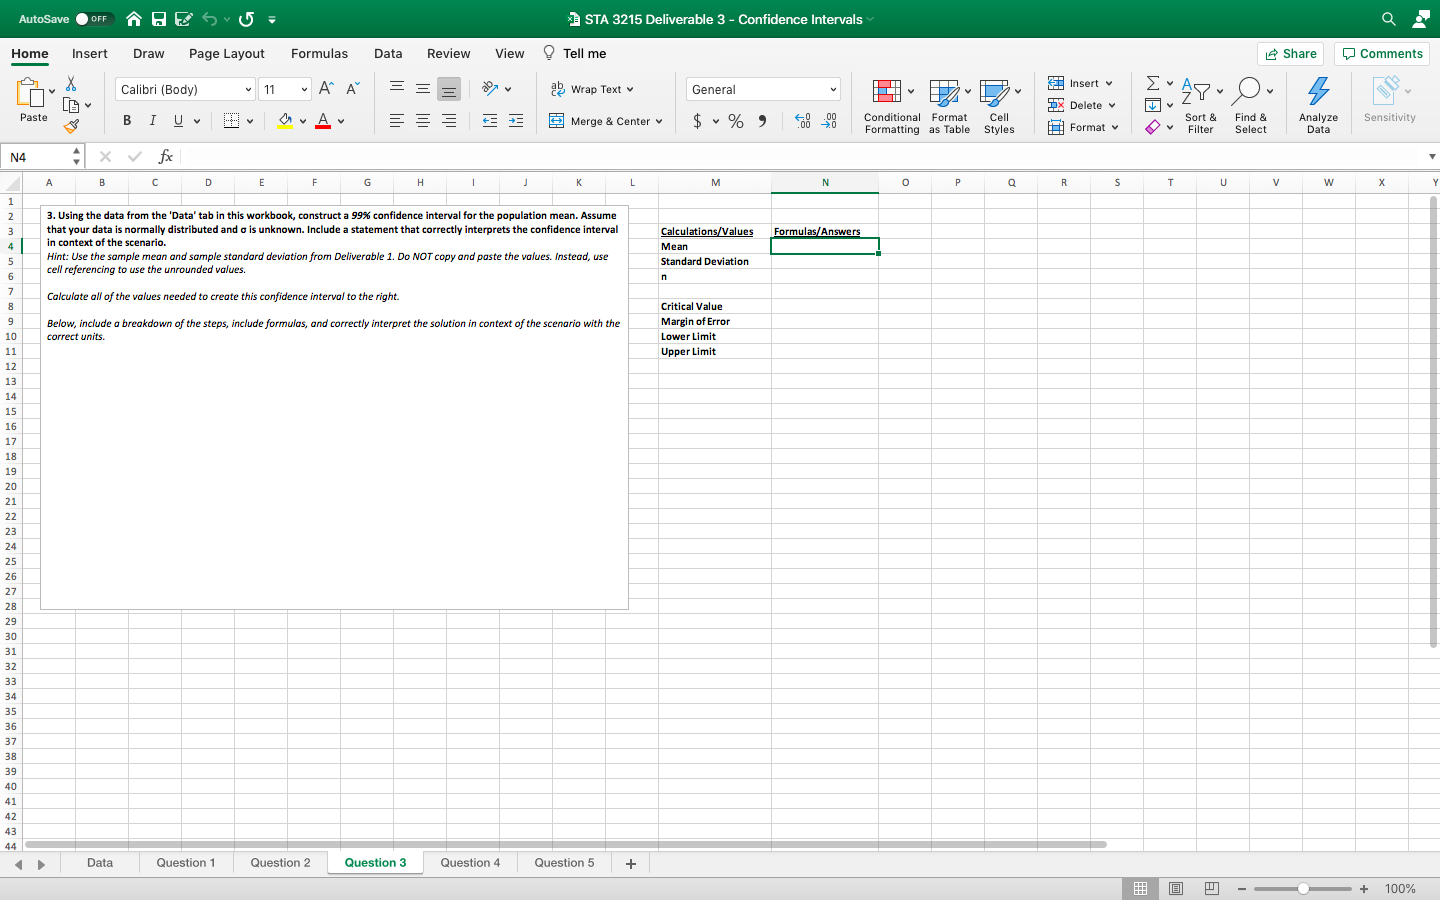
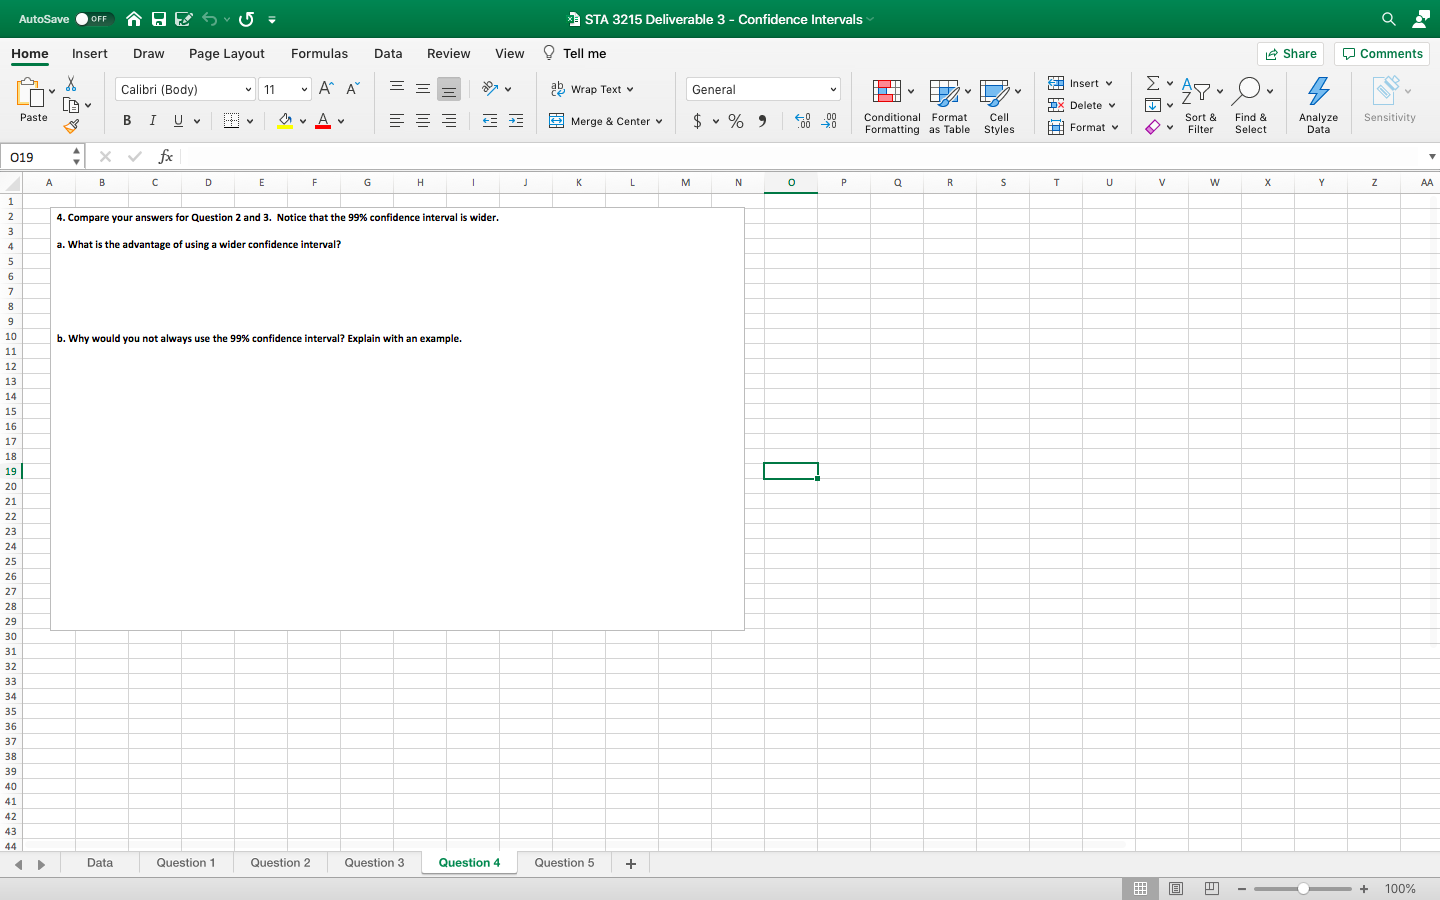
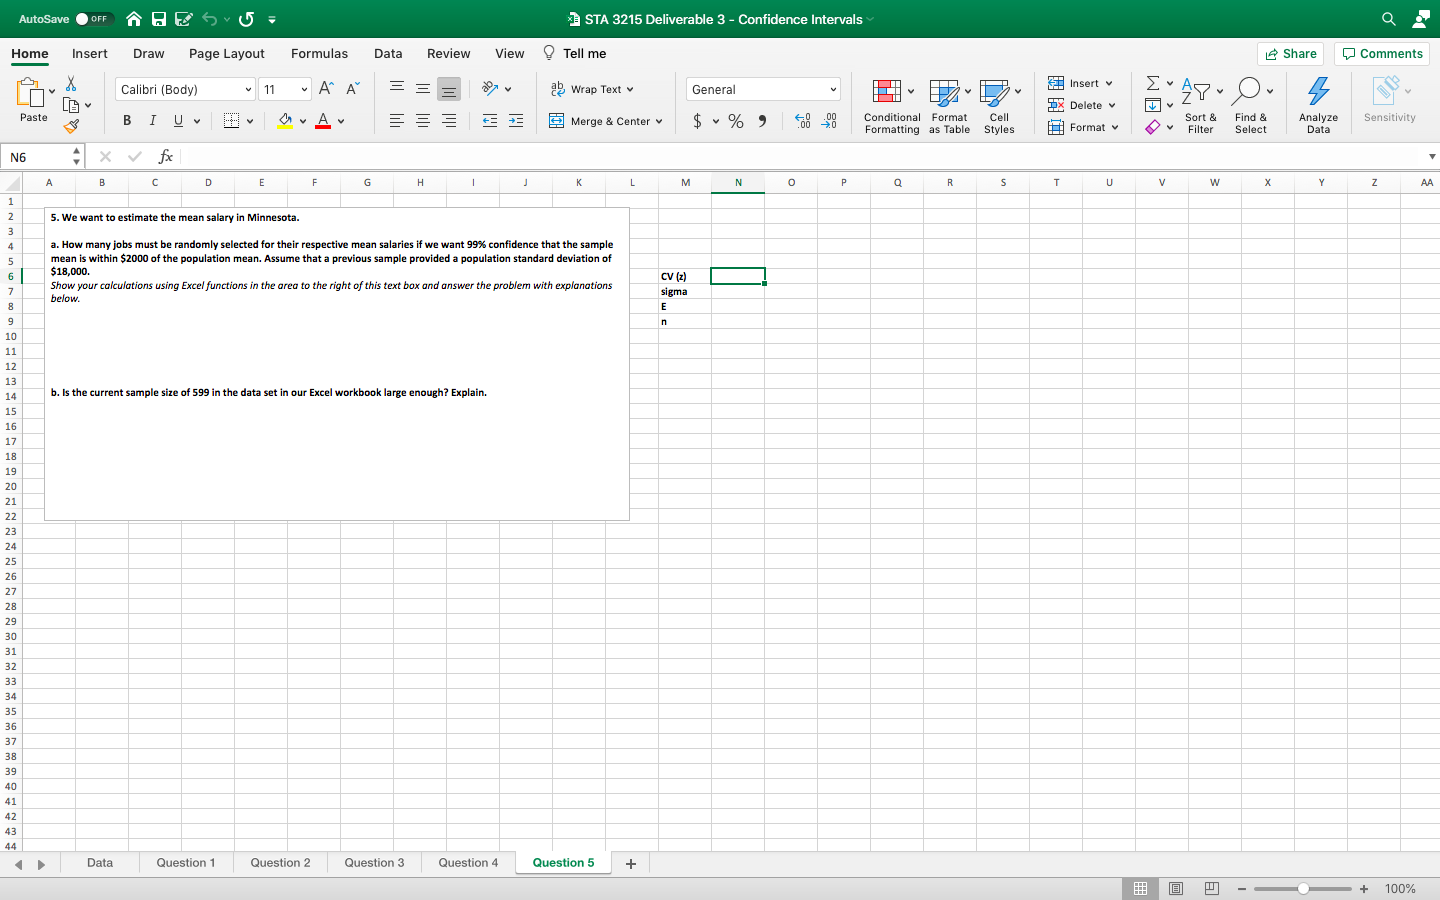
STA 3215 Deliverable 3 - Confidence Intervals Q AutoSave . OFF Page Layout Formulas Data Review View Tell me Share Comments Home Insert Draw Insert v Calibri (Body) * 11 AA ab Wrap Text v General Ex AY - O. Ex Delete v $ ~ % " Sort & Find & Sensitivity E Conditional Format Paste BIU BY OvAv Merge & Center v Cell Analyze Formatting as Table Styles Format v Filter Select Data Q16 41 X V fx AA C D E F G H J K L M N 0 P Q R S T U V W X Z 1. Discuss the importance of constructing confidence intervals for the population mean by answering these questions. a. What are confidence intervals? b. What is a point estimate? 10 11 12 13 c. What is the best point estimate for the population mean? Explain. 14 15 16 17 d. Why do we need confidence intervals? 18 19 20 21 Data Question 1 Question 2 Question 3 Question 4 Question 5 + - + 100%AutoSave . OFF STA 3215 Deliverable 3 - Confidence Intervals Q Home Insert Draw Page Layout Formulas Data Review View Tell me Share Comments AA" ab Wrap Text General Insert v Calibri (Body) * 11 =1 Ex AY- O. Ex Delete v Paste BIU E EEE Merge & Center v $ ~ % " Conditional Format Cell Sort & Find & Analyze Sensitivity Formatting as Table Styles Format v v Filter Select Data N4 41 X V fx E F G H K M N Q R S T U V W X 2. Using the data from the 'Data' tab in this workbook, construct a 95% confidence interval for the population mean. Assume that your data is normally distributed and o is unknown. Include a statement that correctly interprets the Calculations/Values Formulas/Answers confidence interval in context of the scenario. Mean Hint: Use the sample mean and sample standard deviation from Deliverable 1. Do NOT copy and paste the values. Instead, use Standard Deviation cell referencing to use the unrounded values. Calculate all of the values needed to create this confidence interval to the right. Critical Value Below, include a breakdown of the steps, include formulas, and correctly interpret the solution in context of the scenario with Margin of Error 10 the correct units. Lower Limit 11 Upper Limit 12 13 14 15 16 17 18 Data Question 1 Question 2 Question 3 Question 4 Question 5 + + 100%AutoSave . OFF STA 3215 Deliverable 3 - Confidence Intervals Q Home Insert Draw Page Layout Formulas Data Review View Tell me Share Comments Calibri (Body) * 11 AA" General Insert v =1 ab Wrap Text v Ex AY - O. 4 Ex Delete v Paste BIUVE E Merge & Center v $ ~ % " Conditional Format Cell Sort & Find & Analyze Sensitivity Formatting as Table Styles Format v v Filter Select Data N4 4 X V fx E G H M N P Q R S T U v W 3. Using the data from the 'Data' tab in this workbook, construct a 99% confidence interval for the population mean. Assume NAWNE that your data is normally distributed and o is unknown. Include a statement that correctly interprets the confidence interval Calculations/Values Formulas/Answers in context of the scenario. Mean Hint: Use the sample mean and sample standard deviation from Deliverable 1. Do NOT copy and poste the values. Instead, use Standard Deviation cell referencing to use the unrounded values Calculate all of the values needed to create this confidence interval to the right. Critical Value Below, include a breakdown of the steps, include formulas, and correctly interpret the solution in context of the scenario with the Margin of Error 10 correct units. Lower Limit 11 Upper Limit 12 13 14 15 16 17 18 Data Question 1 Question 2 Question 3 Question 4 Question 5 + - + 100%Q AutoSave . OFF STA 3215 Deliverable 3 - Confidence Intervals Page Layout Formulas View Share Comments Home Insert Draw Data Review Tell me Insert v Calibri (Body) * 11 AA" ab Wrap Text General Ex AY - O. 4 Ex Delete v Sort & Find & Analyze Sensitivity Paste BIU BY OvAv E Merge & Center v $ ~ % " Conditional Format Cell Formatting as Table Styles Format v v Filter Select Data 019 x v fx D E G H K L M N 0 P Q R S T U v w X Z AA 4. Compare your answers for Question 2 and 3. Notice that the 99% confidence interval is wider. a. What is the advantage of using a wider confidence interval? LD C 10 b. Why would you not always use the 99% confidence interval? Explain with an example. 11 12 13 14 15 16 17 18 19 Data Question 1 Question 2 Question 3 Question 4 Question 5 + - + 100%AutoSave . OFF STA 3215 Deliverable 3 - Confidence Intervals Q Home Insert Draw Page Layout Formulas Data Review View Tell me Share Comments Insert v Calibri (Body) * 11 AA = a Wrap Text v General Ex AY - O. Ex Delete v E Sort & Find & Analyze Sensitivity Paste BIU BY OvAv E Merge & Center v $ ~ % " Conditional Format Cell Formatting as Table Styles Format v v Filter Select Data N6 4 x v fx D E F G H 1 J K L M N 0 P Q R S T U v w X Z AA 5. We want to estimate the mean salary in Minnesota. a. How many jobs must be randomly selected for their respective mean salaries if we want 99% confidence that the sample mean is within $2000 of the population mean. Assume that a previous sample provided a population standard deviation of $18,000 V (z) Show your calculations using Excel functions in the area to the right of this text box and answer the problem with explanations sigma below. 10 11 12 13 14 b. Is the current sample size of 599 in the data set in our Excel workbook large enough? Explain. 15 16 17 18 19 20 Data Question 1 Question 2 Question 3 Question 4 Question 5 + - + 100%
Step by Step Solution
There are 3 Steps involved in it
Step: 1
Get Instant Access to Expert-Tailored Solutions
See step-by-step solutions with expert insights and AI powered tools for academic success
Step: 2
Step: 3
Ace Your Homework with AI
Get the answers you need in no time with our AI-driven, step-by-step assistance