

Question
Please help!!! All information needed is attached!! Calculate accurate financial formulas to assess the businesss current financial health. Specifically, calculate the following formulas using the
Please help!!! All information needed is attached!!
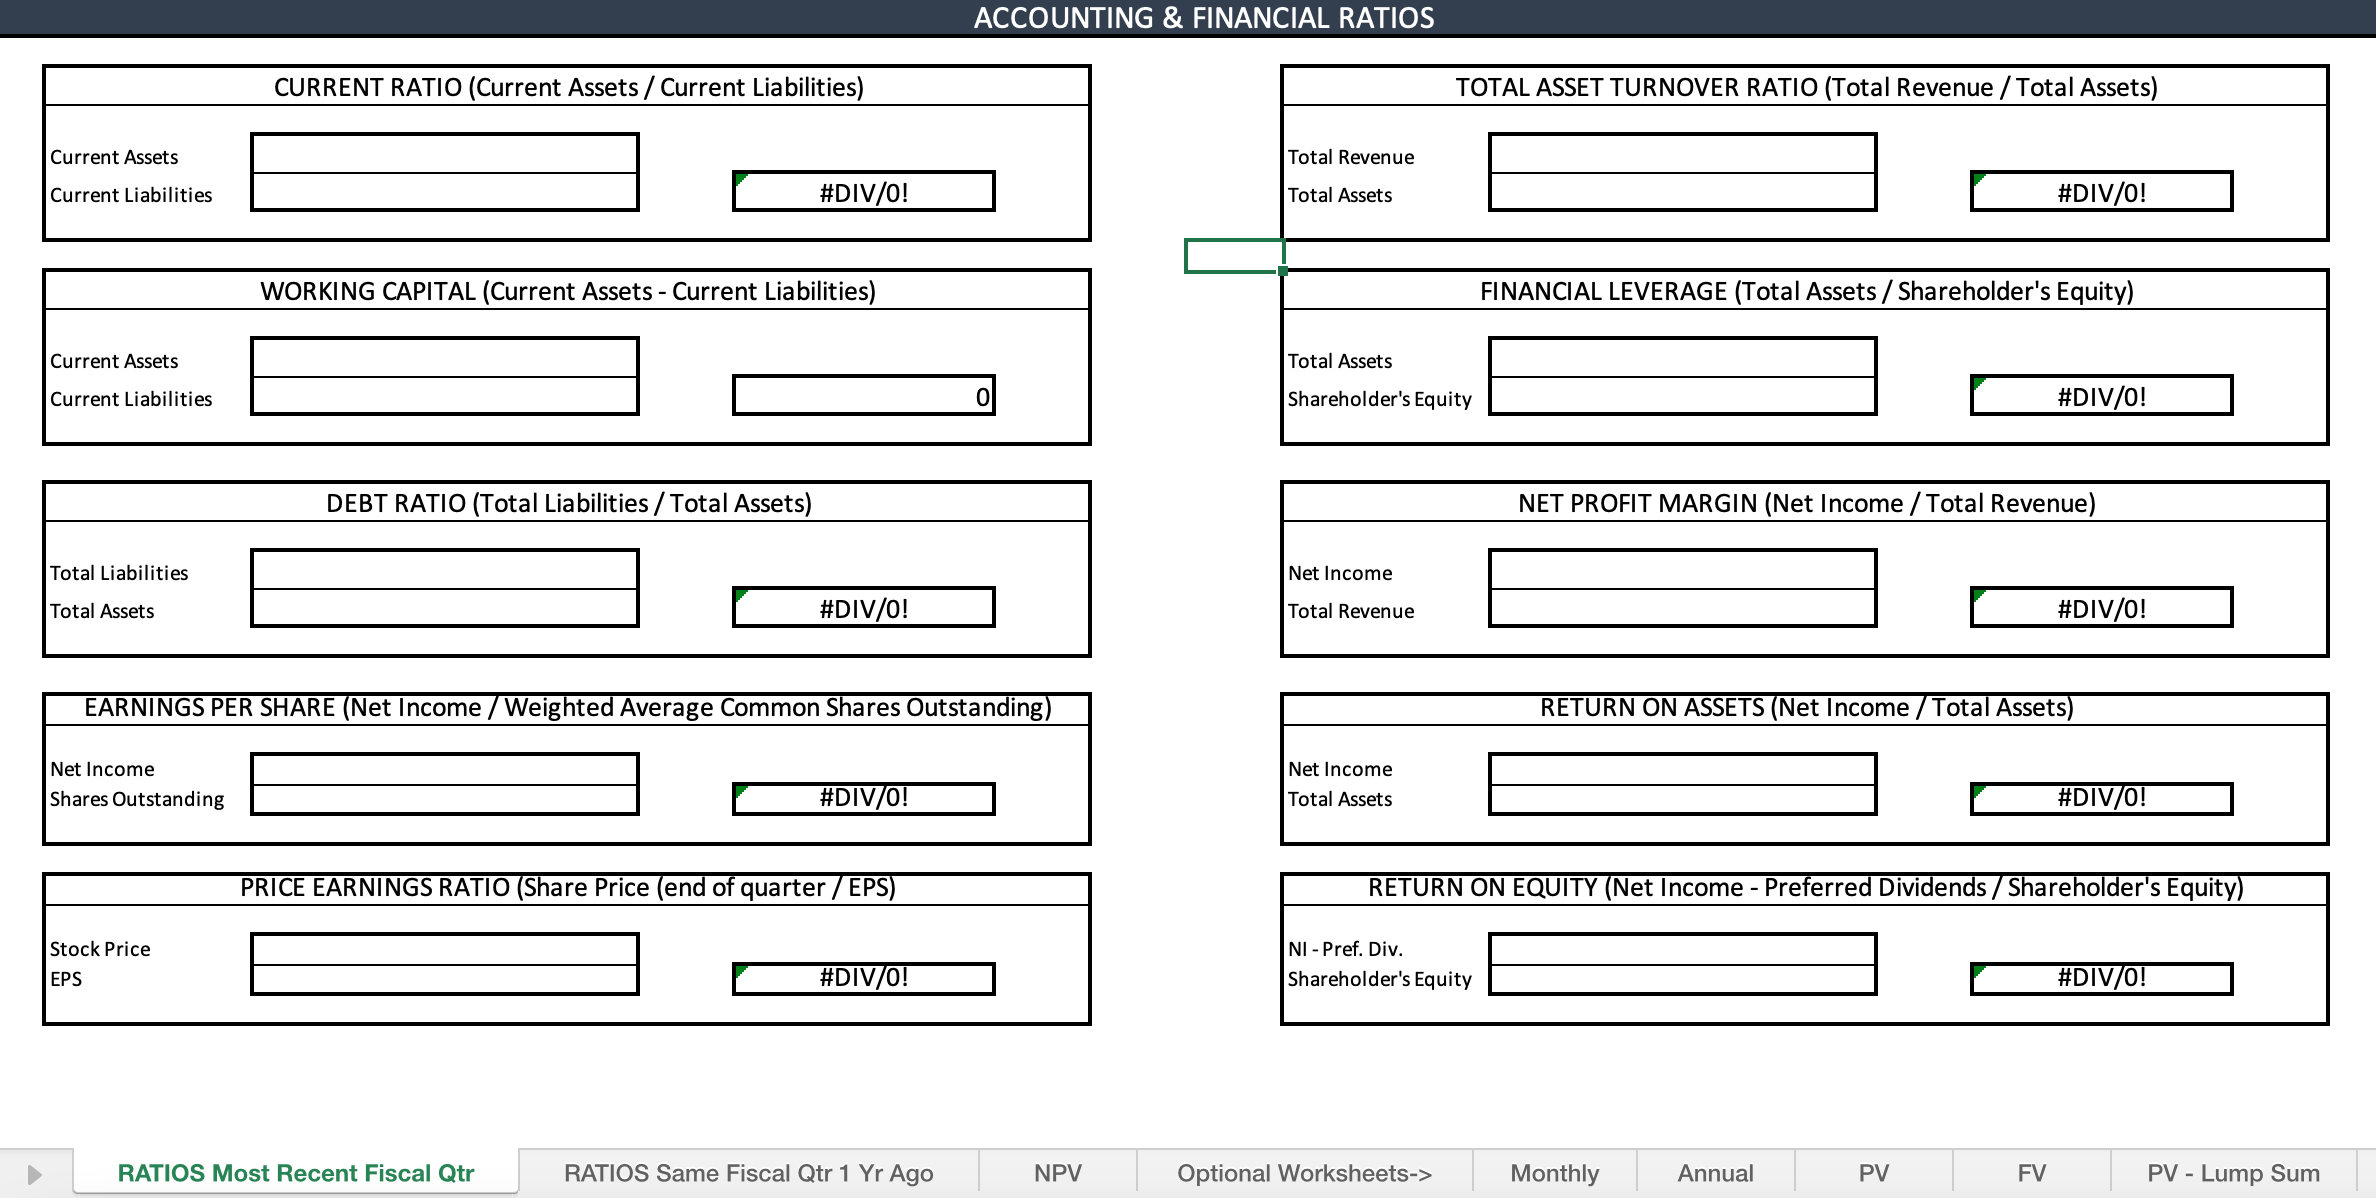
Calculate accurate financial formulas to assess the businesss current financial health. Specifically, calculate the following formulas using the Ratios Most Recent Fiscal Qtr
- Working capital
- Current ratio
- Debt ratio
- Earnings per share
- Price/earnings ratio
- Total asset turnover ratio
- Financial leverage
- Net profit margin
- Return on assets
- Return on equity
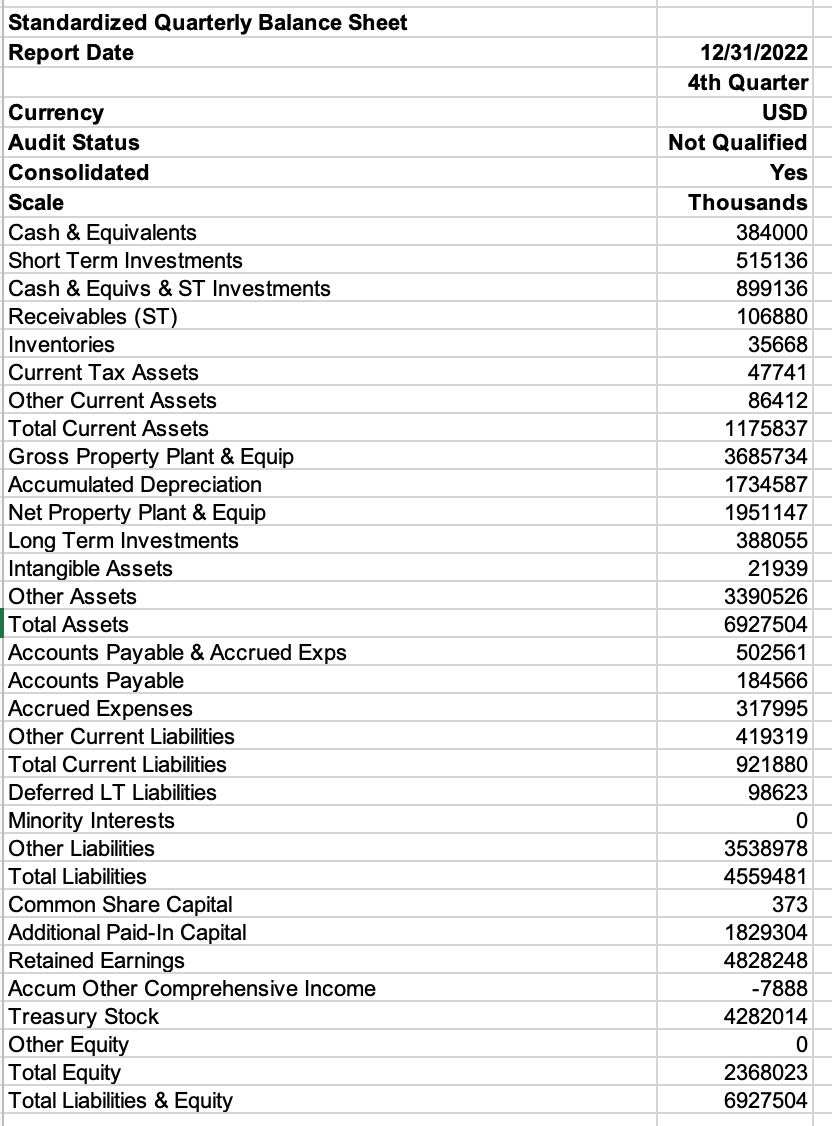
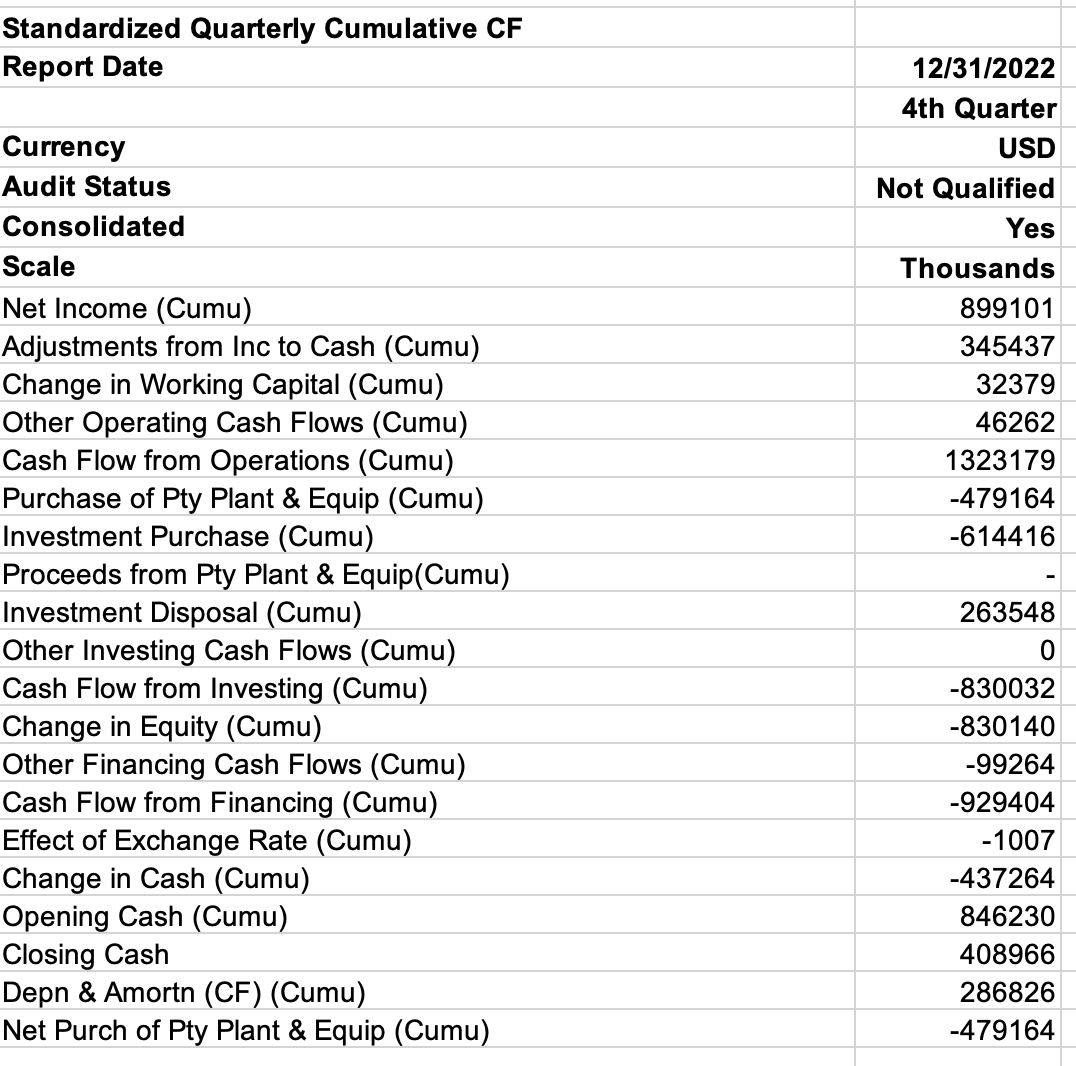
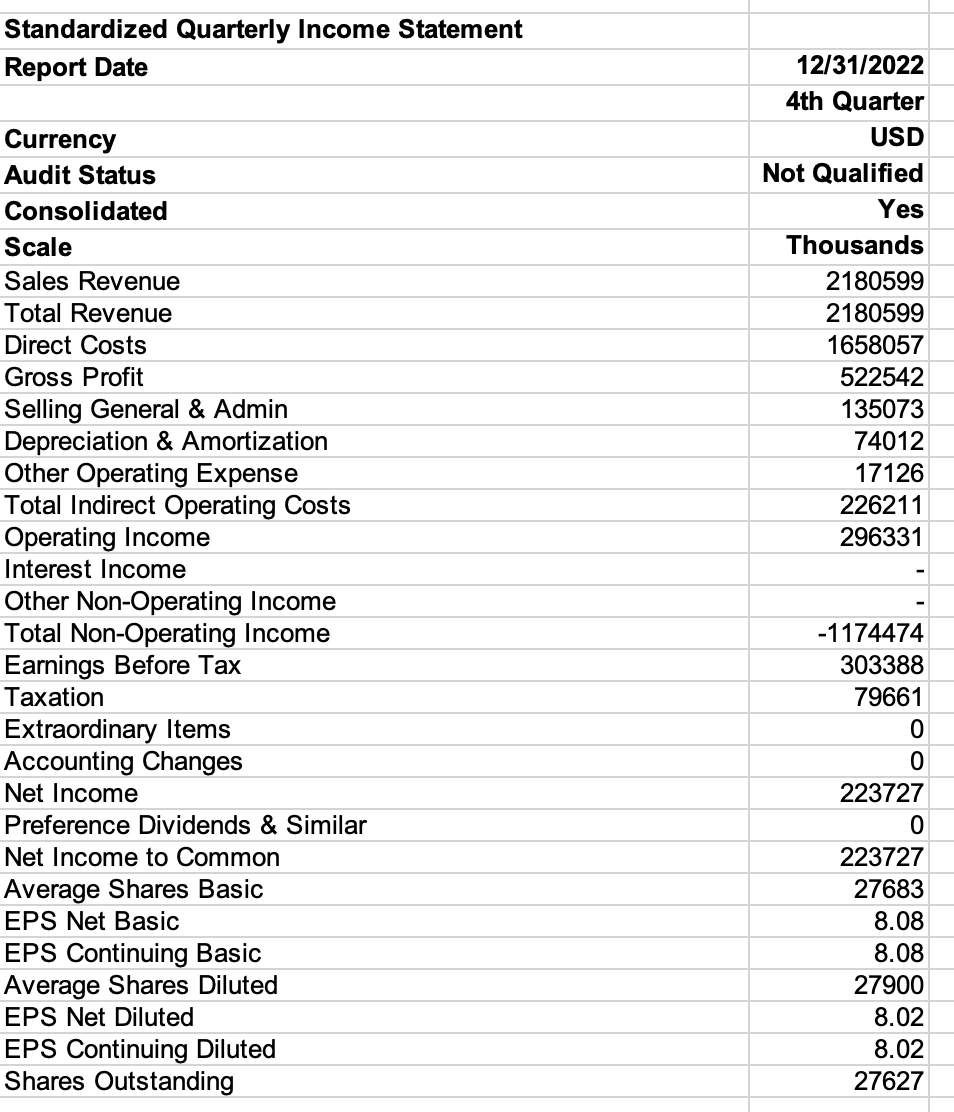
 Standardized Quarterly Balance Sheet \begin{tabular}{|l|r} \hline Report Date & 12/31/2022 \\ \hline & 4th Quarter \\ \hline Currency & USD \\ \hline Audit Status & Not Qualified \\ \hline Consolidated & Yes \\ \hline Scale & Thousands \\ \hline Cash \& Equivalents & 384000 \\ \hline Short Term Investments & 515136 \\ \hline Cash \& Equivs \& ST Investments & 899136 \\ \hline Receivables (ST) & 106880 \\ \hline Inventories & 35668 \\ \hline Current Tax Assets & 47741 \\ \hline Other Current Assets & 86412 \\ \hline Total Current Assets & 1175837 \\ \hline Gross Property Plant \& Equip & 3685734 \\ \hline Accumulated Depreciation & 1734587 \\ \hline Net Property Plant \& Equip & 1951147 \\ \hline Long Term Investments & 388055 \\ \hline Intangible Assets & 21939 \\ \hline Other Assets & 3390526 \\ \hline Total Assets & 6927504 \\ \hline Accounts Payable \& Accrued Exps & 502561 \\ \hline Accounts Payable & 184566 \\ \hline Accrued Expenses & 317995 \\ \hline Other Current Liabilities & 419319 \\ \hline Total Current Liabilities & 921880 \\ \hline Deferred LT Liabilities & 98623 \\ \hline Minority Interests & 0 \\ \hline Other Liabilities & 3538978 \\ \hline Total Liabilities & 4559481 \\ \hline Common Share Capital & 373 \\ \hline Additional Paid-In Capital & 1829304 \\ \hline Retained Earnings & 4828248 \\ \hline Accum Other Comprehensive Income & -7888 \\ \hline Other Equity & 4282014 \\ \hline Total Equity & 2368023 \\ \hline Total Liabilities \& Equity & 6927504 \\ \hline \end{tabular} Standardized Quarterly Cumulative CF \begin{tabular}{l|r} \hline Report Date & 12/31/2022 \\ \hline & 4th Quarter \\ \hline Currency & USD \\ \hline Audit Status & Yot Qualified \\ \hline Consolidated & Thousands \\ \hline Scale & 899101 \\ \hline Net Income (Cumu) & 345437 \\ \hline Adjustments from Inc to Cash (Cumu) & 32379 \\ \hline Change in Working Capital (Cumu) & 46262 \\ \hline Other Operating Cash Flows (Cumu) & 1323179 \\ \hline Cash Flow from Operations (Cumu) & -479164 \\ \hline Purchase of Pty Plant \& Equip (Cumu) & -614416 \\ \hline Investment Purchase (Cumu) & - \\ \hline Investment Disposal (Cumu) & 263548 \\ \hline Other Investing Cash Flows (Cumu) & 0 \\ Cash Flow from Investing (Cumu) & -830032 \\ \hline Change in Equity (Cumu) & -830140 \\ \hline Other Financing Cash Flows (Cumu) & -99264 \\ \hline Cash Flow from Financing (Cumu) & -929404 \\ \hline Effect of Exchange Rate (Cumu) & -1007 \\ \hline Change in Cash (Cumu) & -437264 \\ \hline Opening Cash (Cumu) & 846230 \\ \hline Closing Cash & 408966 \\ \hline Depn \& Amortn (CF) (Cumu) & 286826 \\ \hline Net Purch of Pty Plant \& Equip (Cumu) & -479164 \\ \hline \end{tabular} Standardized Quarterly Income Statement ACCOUNTING \& FINANCIAL RATIOS \begin{tabular}{|l|l|} \hline & TOTAL ASSET TURNOVER RATIO (Total Revenue / Total Assets) \\ \hline Total Revenue \\ Total Assets \end{tabular} \begin{tabular}{|l|l|} \hline \multicolumn{2}{|c|}{ DEBT RATIO (Total Liabilities / Total Assets) } \\ \hline TotalLiabilitiesTotalAssets & \#DIV/0! \\ \hline \end{tabular} \begin{tabular}{|l|l|} \hline & NET PROFIT MARGIN (Net Income / Total Revenue) \\ \hline NetIncomeTotalRevenue & \#DIV/0! \\ \hline \end{tabular} \begin{tabular}{|l|l|} \hline EARNINGS PER SHARE (Net Income / Weighted Average Common Shares Outstanding) \\ \hline NetIncomeSharesOutstanding \\ \hline \end{tabular} \begin{tabular}{|ll|} \hline & RETURN ON ASSETS (Net Income / Total Assets) \\ \hline NetIncomeTotalAssets & \\ \hline \end{tabular} \begin{tabular}{|ll|} \hline & PRICE EARNINGS RATIO (Share Price (end of quarter /EPS) \\ \hline StockPriceEPS & \\ \hline \end{tabular} \begin{tabular}{|l|l|} \hline \multicolumn{2}{|c|}{ RETURN ON EQUITY (Net Income - Preferred Dividends/Shareholder's Equity) } \\ \hline NI-Pref.Div.ShareholdersEquity \\ \hline \end{tabular} Standardized Quarterly Balance Sheet \begin{tabular}{|l|r} \hline Report Date & 12/31/2022 \\ \hline & 4th Quarter \\ \hline Currency & USD \\ \hline Audit Status & Not Qualified \\ \hline Consolidated & Yes \\ \hline Scale & Thousands \\ \hline Cash \& Equivalents & 384000 \\ \hline Short Term Investments & 515136 \\ \hline Cash \& Equivs \& ST Investments & 899136 \\ \hline Receivables (ST) & 106880 \\ \hline Inventories & 35668 \\ \hline Current Tax Assets & 47741 \\ \hline Other Current Assets & 86412 \\ \hline Total Current Assets & 1175837 \\ \hline Gross Property Plant \& Equip & 3685734 \\ \hline Accumulated Depreciation & 1734587 \\ \hline Net Property Plant \& Equip & 1951147 \\ \hline Long Term Investments & 388055 \\ \hline Intangible Assets & 21939 \\ \hline Other Assets & 3390526 \\ \hline Total Assets & 6927504 \\ \hline Accounts Payable \& Accrued Exps & 502561 \\ \hline Accounts Payable & 184566 \\ \hline Accrued Expenses & 317995 \\ \hline Other Current Liabilities & 419319 \\ \hline Total Current Liabilities & 921880 \\ \hline Deferred LT Liabilities & 98623 \\ \hline Minority Interests & 0 \\ \hline Other Liabilities & 3538978 \\ \hline Total Liabilities & 4559481 \\ \hline Common Share Capital & 373 \\ \hline Additional Paid-In Capital & 1829304 \\ \hline Retained Earnings & 4828248 \\ \hline Accum Other Comprehensive Income & -7888 \\ \hline Other Equity & 4282014 \\ \hline Total Equity & 2368023 \\ \hline Total Liabilities \& Equity & 6927504 \\ \hline \end{tabular} Standardized Quarterly Cumulative CF \begin{tabular}{l|r} \hline Report Date & 12/31/2022 \\ \hline & 4th Quarter \\ \hline Currency & USD \\ \hline Audit Status & Yot Qualified \\ \hline Consolidated & Thousands \\ \hline Scale & 899101 \\ \hline Net Income (Cumu) & 345437 \\ \hline Adjustments from Inc to Cash (Cumu) & 32379 \\ \hline Change in Working Capital (Cumu) & 46262 \\ \hline Other Operating Cash Flows (Cumu) & 1323179 \\ \hline Cash Flow from Operations (Cumu) & -479164 \\ \hline Purchase of Pty Plant \& Equip (Cumu) & -614416 \\ \hline Investment Purchase (Cumu) & - \\ \hline Investment Disposal (Cumu) & 263548 \\ \hline Other Investing Cash Flows (Cumu) & 0 \\ Cash Flow from Investing (Cumu) & -830032 \\ \hline Change in Equity (Cumu) & -830140 \\ \hline Other Financing Cash Flows (Cumu) & -99264 \\ \hline Cash Flow from Financing (Cumu) & -929404 \\ \hline Effect of Exchange Rate (Cumu) & -1007 \\ \hline Change in Cash (Cumu) & -437264 \\ \hline Opening Cash (Cumu) & 846230 \\ \hline Closing Cash & 408966 \\ \hline Depn \& Amortn (CF) (Cumu) & 286826 \\ \hline Net Purch of Pty Plant \& Equip (Cumu) & -479164 \\ \hline \end{tabular} Standardized Quarterly Income Statement ACCOUNTING \& FINANCIAL RATIOS \begin{tabular}{|l|l|} \hline & TOTAL ASSET TURNOVER RATIO (Total Revenue / Total Assets) \\ \hline Total Revenue \\ Total Assets \end{tabular} \begin{tabular}{|l|l|} \hline \multicolumn{2}{|c|}{ DEBT RATIO (Total Liabilities / Total Assets) } \\ \hline TotalLiabilitiesTotalAssets & \#DIV/0! \\ \hline \end{tabular} \begin{tabular}{|l|l|} \hline & NET PROFIT MARGIN (Net Income / Total Revenue) \\ \hline NetIncomeTotalRevenue & \#DIV/0! \\ \hline \end{tabular} \begin{tabular}{|l|l|} \hline EARNINGS PER SHARE (Net Income / Weighted Average Common Shares Outstanding) \\ \hline NetIncomeSharesOutstanding \\ \hline \end{tabular} \begin{tabular}{|ll|} \hline & RETURN ON ASSETS (Net Income / Total Assets) \\ \hline NetIncomeTotalAssets & \\ \hline \end{tabular} \begin{tabular}{|ll|} \hline & PRICE EARNINGS RATIO (Share Price (end of quarter /EPS) \\ \hline StockPriceEPS & \\ \hline \end{tabular} \begin{tabular}{|l|l|} \hline \multicolumn{2}{|c|}{ RETURN ON EQUITY (Net Income - Preferred Dividends/Shareholder's Equity) } \\ \hline NI-Pref.Div.ShareholdersEquity \\ \hline \end{tabular}
 Step by Step Solution
There are 3 Steps involved in it
Step: 1

Get Instant Access to Expert-Tailored Solutions
See step-by-step solutions with expert insights and AI powered tools for academic success
Step: 2

Step: 3
Ace Your Homework with AI
Get the answers you need in no time with our AI-driven, step-by-step assistance
Get Started
Financial Whirlpools A Systems Story Of The Great Global Recession
Authors: Karen L. Higgins
1st Edition
0124059058,012405921X