

Answered step by step
Verified Expert Solution
Question
1 Approved Answer
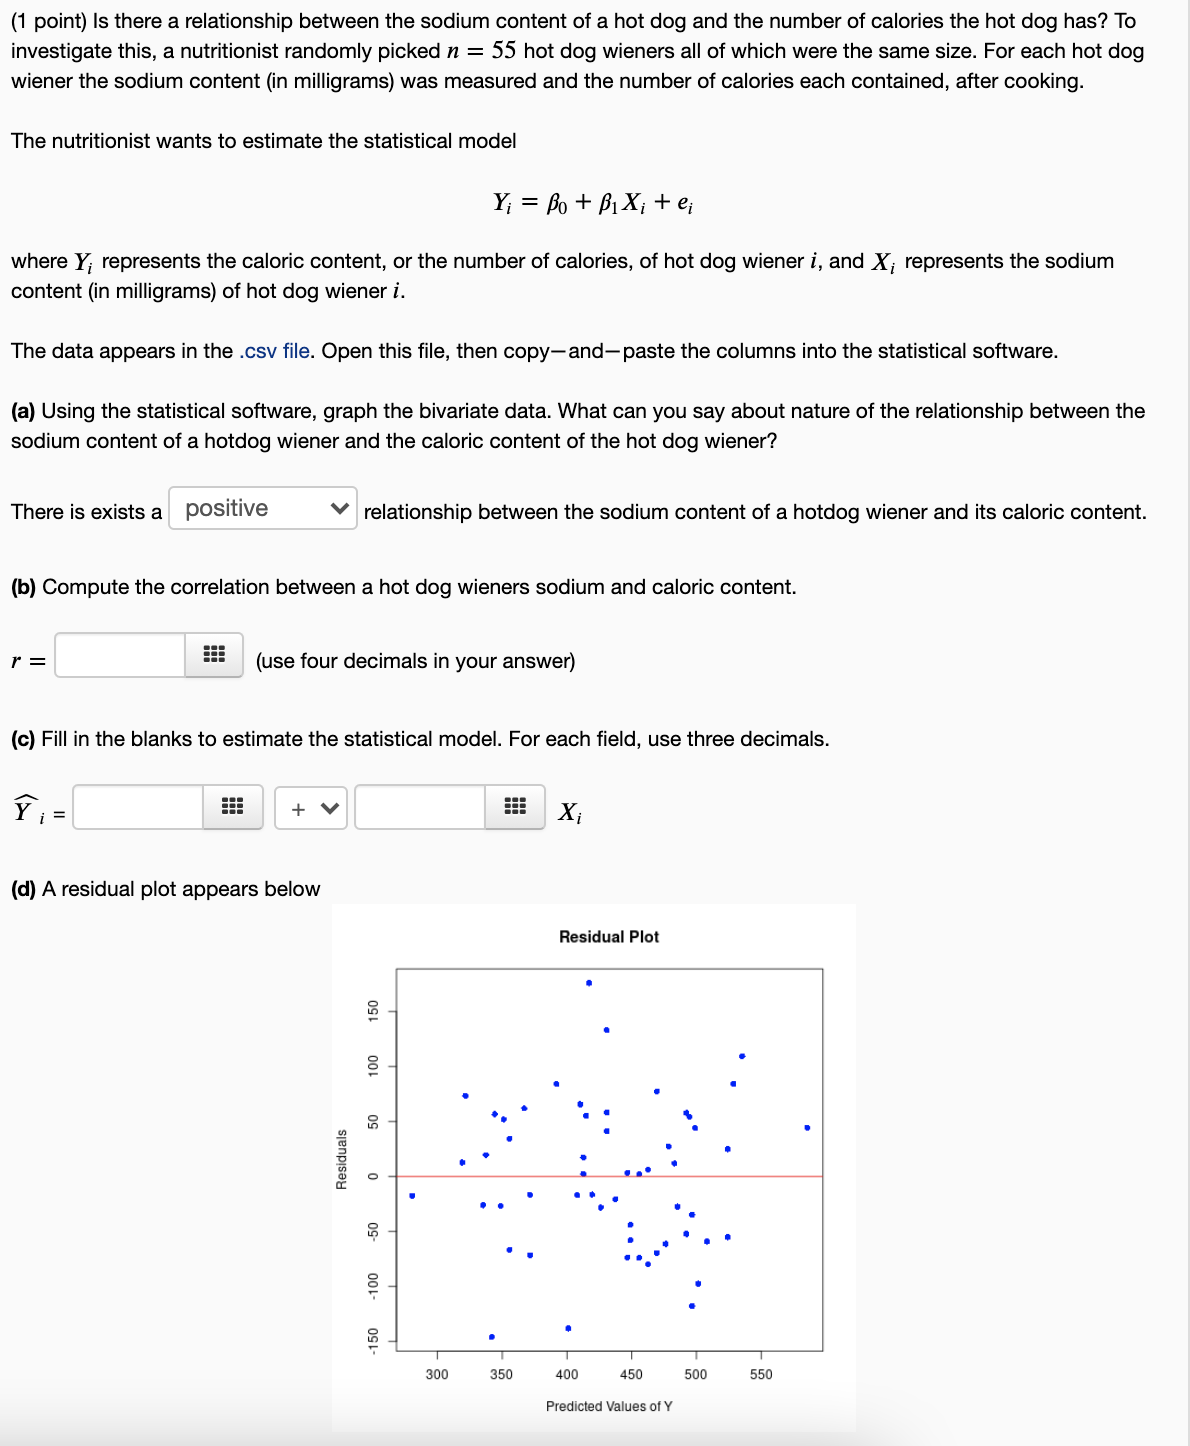
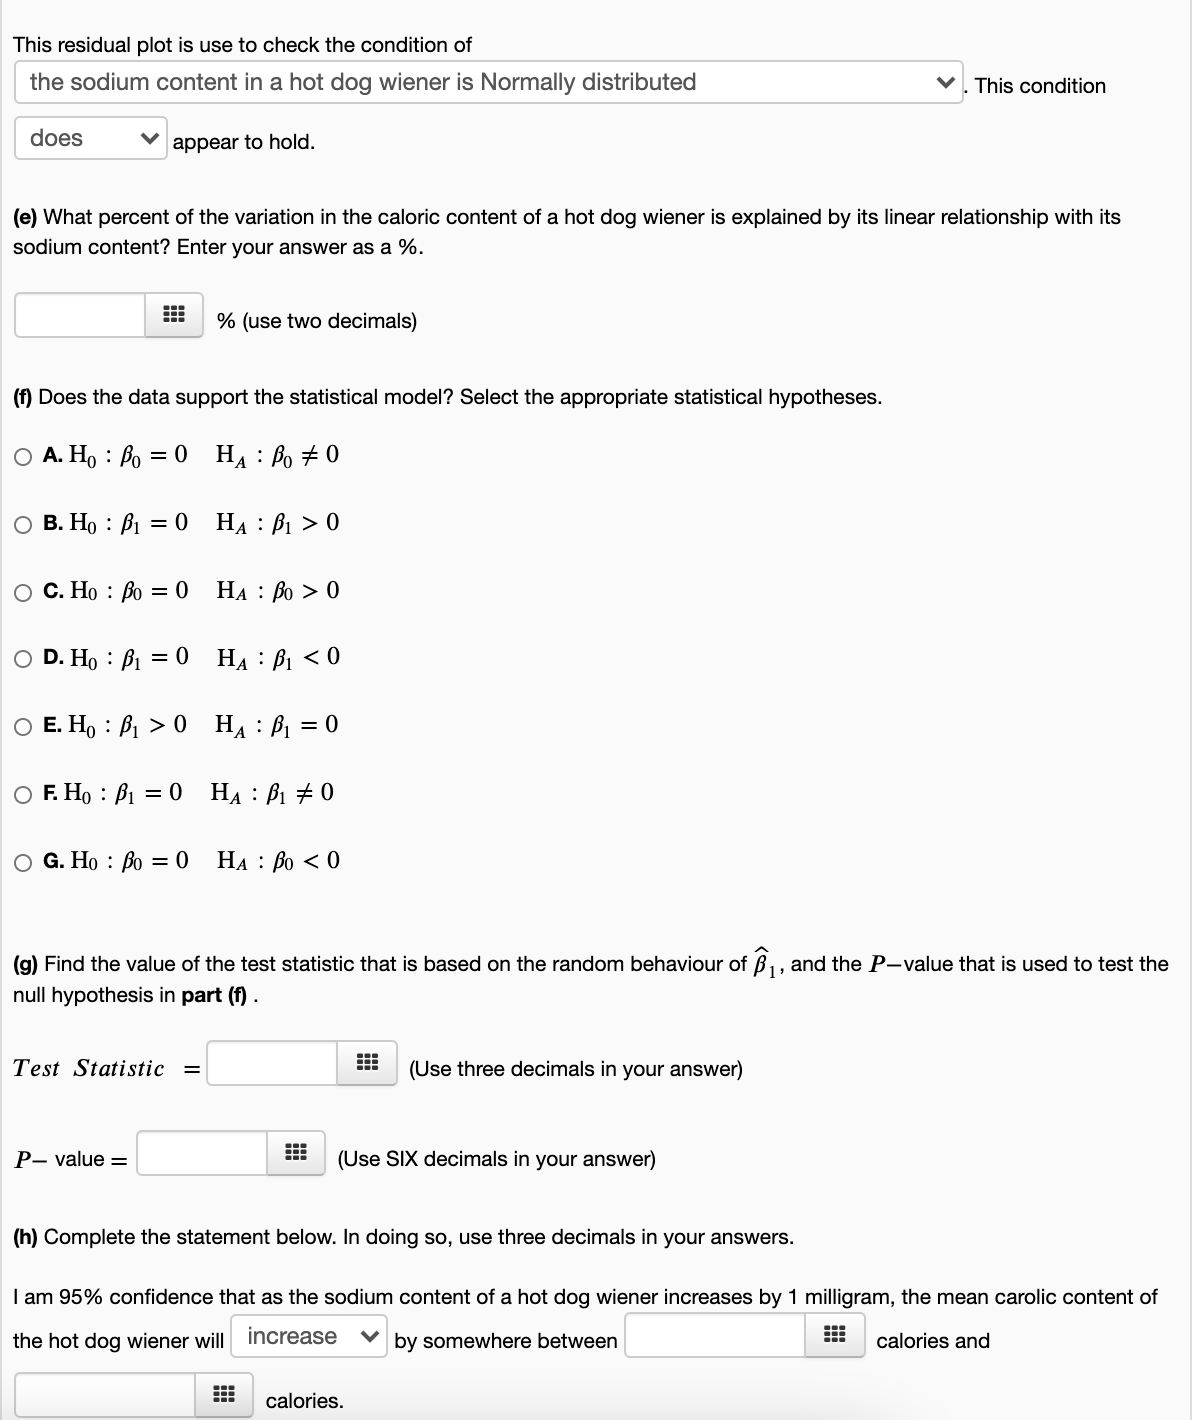
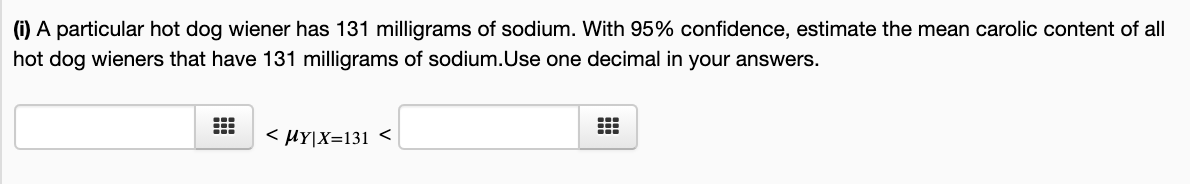
please help and ill give you a thumbs up! link to data: https://docs.google.com/spreadsheets/d/1OOpBxW8vipSmbmaeRB5Ii2Z1lHf7qJ8d79WuPUcNcg8/edit?usp=sharing (1 point) Is there a relationship between the sodium content of a
please help and ill give you a thumbs up!
link to data: https://docs.google.com/spreadsheets/d/1OOpBxW8vipSmbmaeRB5Ii2Z1lHf7qJ8d79WuPUcNcg8/edit?usp=sharing
Step by Step Solution
There are 3 Steps involved in it
Step: 1

Get Instant Access to Expert-Tailored Solutions
See step-by-step solutions with expert insights and AI powered tools for academic success
Step: 2

Step: 3
Ace Your Homework with AI
Get the answers you need in no time with our AI-driven, step-by-step assistance
Get Started
Elementary Algebra
Authors: Charles P McKeague
3rd Edition
1483263843, 9781483263847