

Answered step by step
Verified Expert Solution
Question
1 Approved Answer
Please help and thank you! The demand curve and supply curve for one-year discount bonds with a face value of $1,050 are represented by the
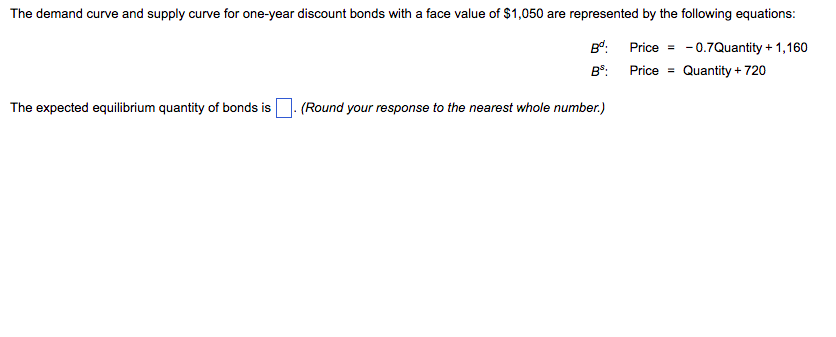
Please help and thank you!
The demand curve and supply curve for one-year discount bonds with a face value of $1,050 are represented by the following equations: B Price = -0.7Quantity + 1,160 B%: Price = Quantity + 720 The expected equilibrium quantity of bonds is (Round your response to the nearest whole number.)Step by Step Solution
There are 3 Steps involved in it
Step: 1

Get Instant Access to Expert-Tailored Solutions
See step-by-step solutions with expert insights and AI powered tools for academic success
Step: 2

Step: 3
Ace Your Homework with AI
Get the answers you need in no time with our AI-driven, step-by-step assistance
Get Started
Industrializing Financial Services With DevOps
Authors: Spyridon Maniotis
1st Edition
1804614343, 978-1804614341