Answered step by step
Verified Expert Solution
Question
1 Approved Answer
Please help answer c , d and e , based on the data of question 5 . Thank you ( 5 ) A local authority
Please help answer c d and e based on the data of question Thank you
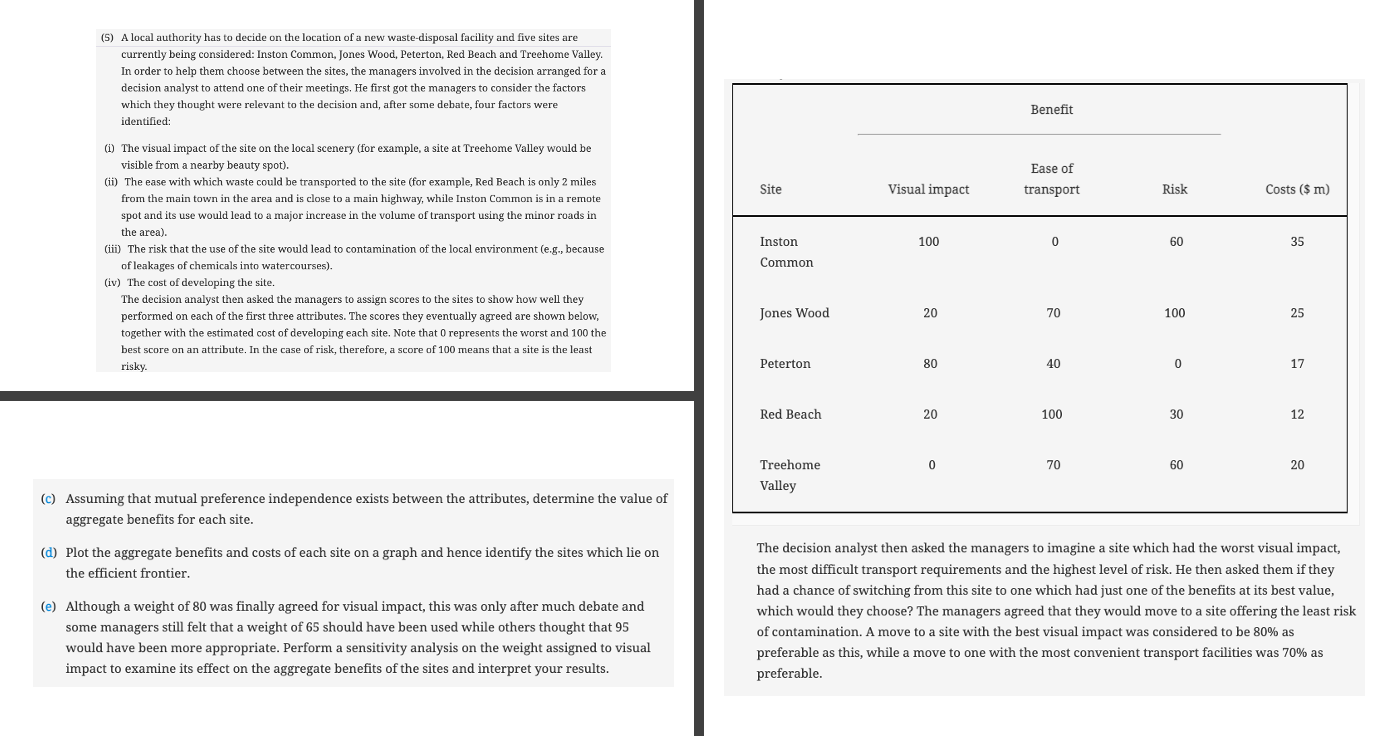
A local authority has to decide on the location of a new wastedisposal facility and five sites are
currently being considered: Inston Common, Jones Wood, Peterton, Red Beach and Treehome Valley.
In order to help them choose between the sites, the managers involved in the decision arranged for a
decision analyst to attend one of their meetings. He first got the managers to consider the factors
which they thought were relevant to the decision and, after some debate, four factors were
identified:
i The visual impact of the site on the local scenery for example, a site at Treehome Valley would be
visible from a nearby beauty spot
ii The ease with which waste could be transported to the site for example, Red Beach is only miles
from the main town in the area and is close to a main highway, while Inston Common is in a remote
spot and its use would lead to a major increase in the volume of transport using the minor roads in
the area
iii The risk that the use of the site would lead to contamination of the local environment eg because
of leakages of chemicals into watercourses
iv The cost of developing the site.
The decision analyst then asked the managers to assign scores to the sites to show how well they
performed on each of the first three attributes. The scores they eventually agreed are shown below,
together with the estimated cost of developing each site. Note that represents the worst and the
best score on an attribute. In the case of risk, therefore, a score of means that a site is the least
risky.
c Assuming that mutual preference independence exists between the attributes, determine the value of
aggregate benefits for each site.
d Plot the aggregate benefits and costs of each site on a graph and hence identify the sites which lie on
the efficient frontier.
e Although a weight of was finally agreed for visual impact, this was only after much debate and
some managers still felt that a weight of should have been used while others thought that
would have been more appropriate. Perform a sensitivity analysis on the weight assigned to visual
impact to examine its effect on the aggregate benefits of the sites and interpret your results.
The decision analyst then asked the managers to imagine a site which had the worst visual impact,
the most difficult transport requirements and the highest level of risk. He then asked them if they
had a chance of switching from this site to one which had just one of the benefits at its best value,
which would they choose? The managers agreed that they would move to a site offering the least risk
of contamination. A move to a site with the best visual impact was considered to be as
preferable as this, while a move to one with the most convenient transport facilities was as
preferable.

Step by Step Solution
There are 3 Steps involved in it
Step: 1

Get Instant Access to Expert-Tailored Solutions
See step-by-step solutions with expert insights and AI powered tools for academic success
Step: 2

Step: 3

Ace Your Homework with AI
Get the answers you need in no time with our AI-driven, step-by-step assistance
Get Started


