Answered step by step
Verified Expert Solution
Link Copied!

Question

1 Approved Answer

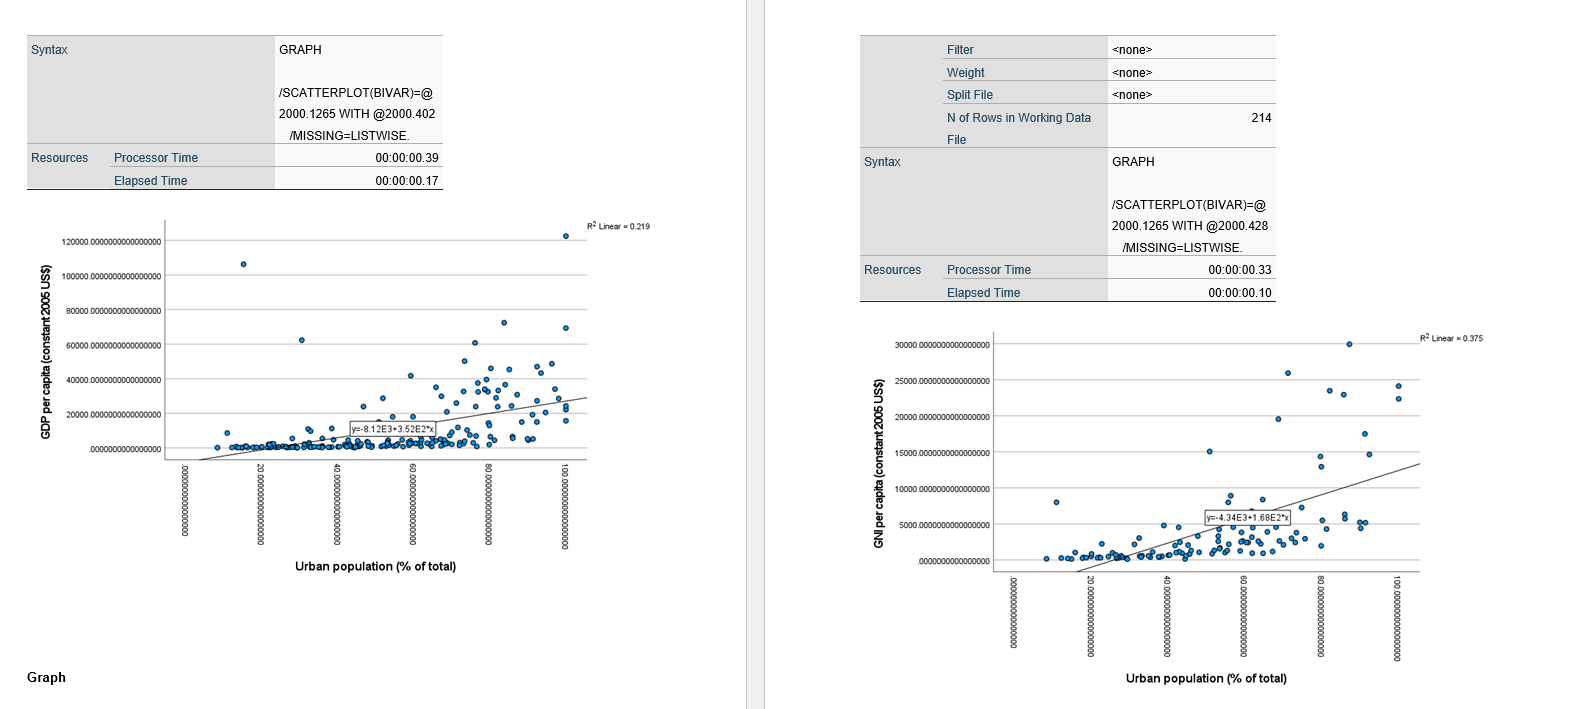
Please help answer the question everything provided below. Syntax GRAPH Filter Weight (SCATTERPLOT(BIVAR)=@ Split File 2000.1265 WITH @2000.402 N of Rows in Working Data 214

Please help answer the question everything provided below.

image text in transcribedimage text in transcribedimage text in transcribedimage text in transcribed
Syntax GRAPH Filter Weight (SCATTERPLOT(BIVAR)=@ Split File 2000.1265 WITH @2000.402 N of Rows in Working Data 214 /MISSING=LISTWISE. File Resources Processor Time 00:00:00.39 Syntax GRAPH Elapsed Time 00:00:00.17 /SCATTERPLOT(BIVAR)=@ R Linear = 0.219 2000.1265 WITH @2000.428 20000.0080800808008000 /MISSING=LISTWISE. Resources Processor Time 00:00:00.33 100000.8000080808008080 Elapsed Time 10:00:00.10 8000 0000000050608080 R Linear = 0.375 60000.080060800608000 30000.0000000000800800 GDP per capita (constant 2005 US$) 10000.0000000808008000 25000.0000000080800800 20000.0000000800600000 20000.0000080080800800 . y=-8.123-3.52E2"x .008000080800800 15000.0000000000000000 GNI per capita (constant 2005 US$) 10000.0000000080800000 0000000000000000 0800008000000000 08 0800008000009000 0Z 0000008008080800 0 0000000000000000 09 0000000800008000 00 =-4.34E3+1.682x 5000.0000000080800000 . Urban population (% of total) 0000000000800000 0000000000000000 0800008080080800 0+ 0000000000000000 08 0000000600000000 09 0000000000080800 02 0000080808008080 004 Graph Urban population (% of total)Statistics Frequencies GDP per capita GNI per capita Urban (constant 2005 (constant 2005 population (% of US$ US$) total) N Valid 194 109 210 Notes Missing 20 105 Output Created 10-FEB-2023 08:19:57 Mean 9223.372036854 4255.68139510 54.42656190476 Comments 777000 6789000 1920 Input Data C:\\Users\\endipi174\\Download Median 2655.946839217 2094.44865460 53.42950000000 s\\wdi (1).sav 643000 3598200 0010 Active Dataset DataSet1 Mode 124.3332075971 112.089864814 100.0000000000 Filter 494100 7079400 000000 Weight Std. Deviation 9223.372036854 6242.91440002 24.50832439399 Split File 777000 6670000 7498 N of Rows in Working Data 214 Variance 329128283.235 38973980.206 600.658 File Skewness 2.946 2.410 .063 Missing Value Handling Definition of Missing User-defined missing values Std. Error of Skewness 175 231 168 are treated as missing. Kurtosis 11.428 5.372 -1.041 Cases Used Statistics are based on all Std. Error of Kurtosis 347 459 334 cases with valid data Range 922.3372036854 922.337203685 91.75400000000 Syntax FREQUENCIES 776000 4776000 00000 VARIABLES=@2000.402 Minimum 124.3332075971 112.089864814 8.246000000000 @2000.428 @2000.1265 494100 7079400 0000 /FORMAT=NOTABLE Maximum 922.3372036854 922.337203685 100.0000000000 /STATISTICS=STDDEV 776000 4776000 000000 VARIANCE RANGE MINIMUM MAXIMUM MEAN a. Multiple modes exist. The smallest value is shown MEDIAN MODE SKEWNESS SESKEW KURTOSIS SEKURT /HISTOGRAM NORMAL Histogram /ORDER=ANALYSIS Resources Processor Time 00:00:02.16 Elapsed Time 00:00:09.62GDP per capita (constant 2005 US$) Urban population (% of total) 20 Mean = 10869 0785944291 500000 Mean - 54,4265619047619200 125 Std. Dev. = 18141.8930444227700000 N - 194 Std. Dev. = 24.5083243939974870 N - 210 100 15 Frequency Frequency 10 50 25 5 0000000008006000 0000000000000080 0600 0000000000000000 00009 1000600000009000 09008 0000000000000000 000004 0000000000000600 0000ZI 0000000090600000 0000000008000000 Or 0000060000006010 DE 0000000000006000 09 0000000000006080 08 0000000000000000 0Z 0606006060060600'00 GDP per capita (constant 2005 US$) Urban population (% of total) GNI per capita (constant 2005 US$) Mean = 4255,6813951067890000 Std. Dev. - 6242.9144000265700000 Graph 60 N - 109 Frequency Notes Output Created 10-FEB-2023 08:33:31 20 Comments Input Data C:\\Users\\endipi174\\Download s\\wdi (1).sav Active Dataset DataSet1 0000005000000000 Filter 3000000000800600 00OS 0000000000600060 000S 0000000000000000 00ODE 0000000000060600 00OSE 0600000060000600 0000Z 0000000000000000 0000 4 Weight Split File N of Rows in Working Data 214 GNI per capita (constant 2005 US$) File1. Begin your report with an overview of the analysis: what are the goals of the study? What are the relevant variables, and how will you be analyzing them? 2. Describe the three variables by referring to the frequency distribution results for statistics. Note the level of measurement for each variable and report the appropriate measure(s) of central tendency. Also note the appropriate measures of variability. 3. Describe the histogram graphs you created for each variable and describe their levels of kurtosis and skew. 4. Analyze the two scatter plot graphs you made. Discuss if it looks like urbanized nations are more likely to have higher Gross Domestic Products and Gross National Incomes. 5. Draw conclusions from the analysis by summarizing the research

Step by Step Solution

There are 3 Steps involved in it

Step: 1

blur-text-image

Get Instant Access to Expert-Tailored Solutions

See step-by-step solutions with expert insights and AI powered tools for academic success

Step: 2

blur-text-image

Step: 3

blur-text-image

Ace Your Homework with AI

Get the answers you need in no time with our AI-driven, step-by-step assistance

Get Started

Recommended Textbook for

More Books

Students also viewed these Economics questions

Question

Distinguish between HRD and human resource management (HRM)

Answered: 1 week ago

Question

Define what the four-fifths rule is.

Answered: 1 week ago