please help as soon s possible
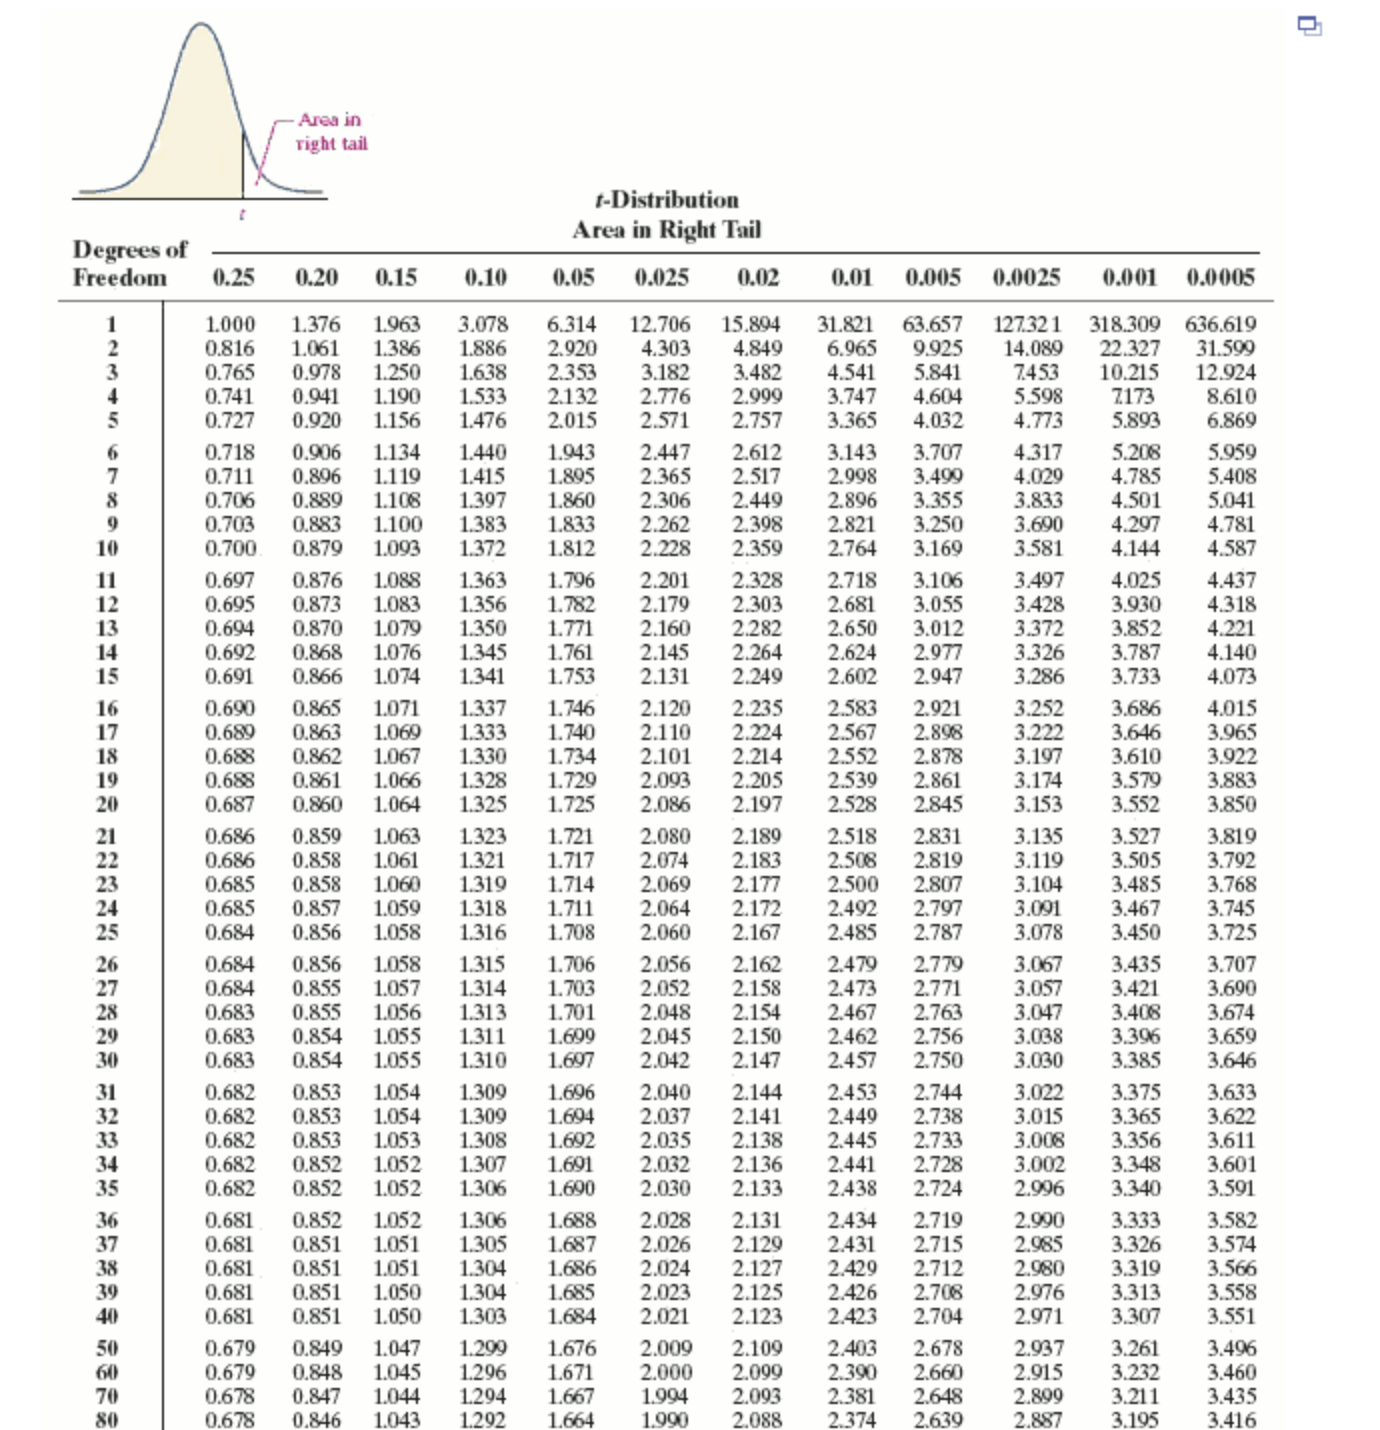
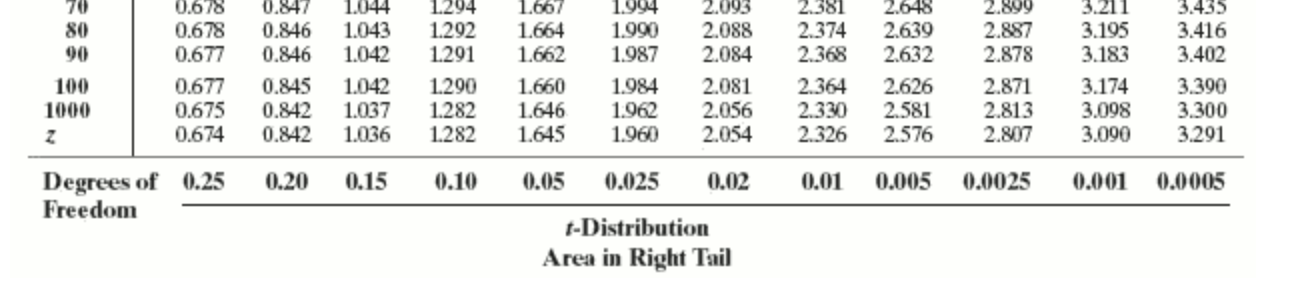
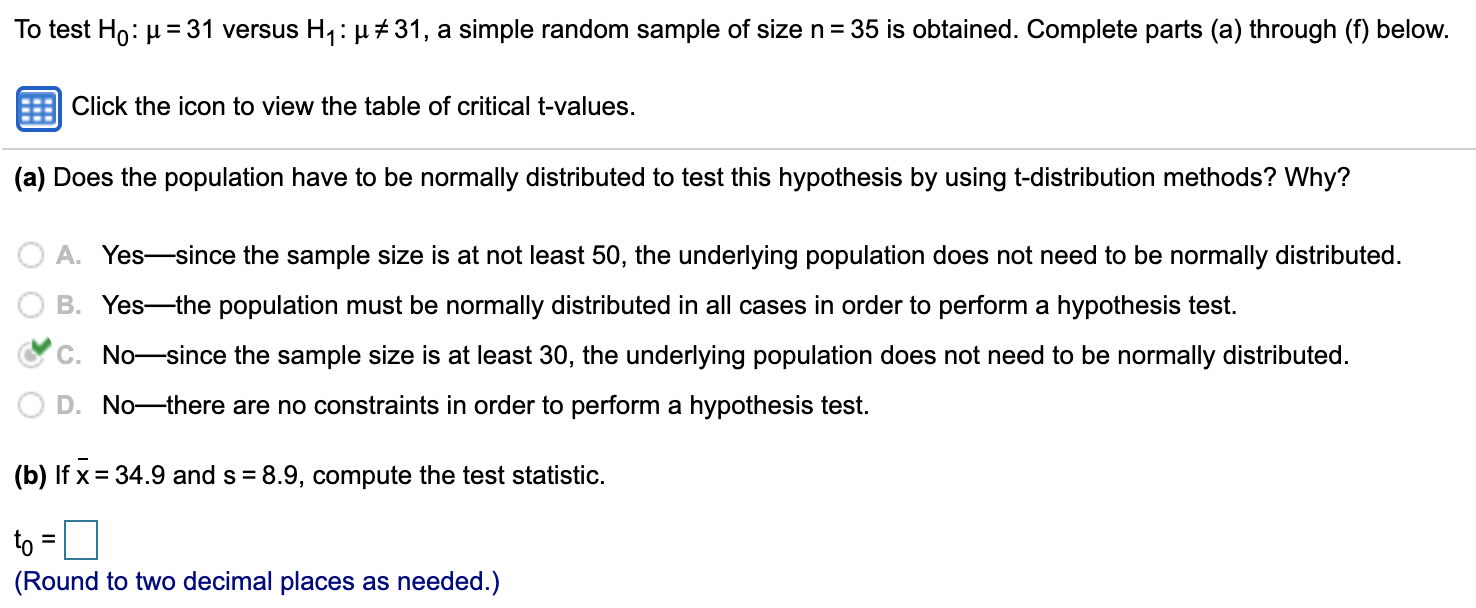
Area in right tail t-Distribution Area in Right Tail Degrees of Freedom 0.25 0.20 0.15 0.10 0.05 0.025 0.02 0.01 0.005 0.0025 0.001 0.0005 1.000 1.376 1.963 3.078 6.314 12.706 15.894 31.821 63.657 127.321 318.309 636.619 0.816 1.061 1.386 1.886 2.920 4.303 4.849 6.965 9.925 14.089 22.327 31.599 0.765 0.978 1.250 1.638 2.353 3.182 3.482 4.541 5.841 7.453 10.215 12.924 0.741 0.941 1.190 1.533 2.132 2.776 2.999 3.747 4.60 5.598 7.173 8.610 0.920 1.156 1.476 2.015 2.571 2.757 3.365 4.032 4.773 5.893 6.869 0.727 5.959 0.718 0.906 1.134 1.440 1.943 2.447 2.612 3.143 3.707 4.317 5.208 0.711 0.896 1.119 1.415 1.895 2.365 2.517 2.998 3.499 4.029 4.785 5.408 0.706 0.889 1.108 1.397 1.860 2.306 2.449 2.896 3.355 3.833 4.501 5.041 0.703 0.883 1.100 1.383 1.833 2.262 2.398 2.821 3.250 3.690 4.297 4.781 0.700 0.879 1.093 1.372 1.812 2.228 2.359 2.764 3.169 3.581 4.144 4.587 0.697 0.876 1.088 1.363 1.796 2.201 2.328 2.718 3.106 3.497 4.025 4.437 0.695 0.873 1083 1.356 1.782 2.179 2.303 2.681 3.055 3.428 3.930 4.318 0.694 0.870 1.079 1.350 1.771 2.160 2.282 2.650 3.012 3.372 3.852 4.221 0.692 0.868 1.076 1.345 1.761 2.145 2.264 2.624 2.977 3.326 3.787 4.140 0.691 0.866 1.074 1.341 1.753 2.131 2.249 2.602 2.947 3.286 3.733 4.073 0.690 0.865 1.071 1.337 1.746 2.120 2.235 2.583 2.921 3.252 3.686 4.015 0.689 0.863 1.069 1.333 1.740 2.110 2.224 2.567 2.898 3.222 3.646 3.965 0.688 0.862 1.067 1.330 1.734 2.101 2.214 2.552 2.878 3.197 3.610 3.922 0.688 0.861 1.066 1.328 1.720 2.093 2.205 2.539 2.861 3.174 3.579 3.883 0.687 0.860 1.064 1.325 1.725 2.086 2.197 2.528 2.845 3.153 3.552 3.850 0.686 0.859 1.063 1.323 1.721 2.080 2.189 2.518 2.831 3.135 3.527 3.819 0.686 0.858 1.061 1.321 1.717 2.074 2.183 2.508 2.819 3.119 3.505 3.792 0.685 0.858 1.060 1.319 1.714 2.069 2.177 2.500 2.807 3.104 3.485 3.768 0.685 0.857 1.059 1.318 1.711 2.064 2.172 2.492 2.797 3.091 3.467 3.745 0.684 0.856 1.058 1.316 1.708 2.060 2.167 2.485 2.787 3.078 3.450 3.725 0.684 0.856 1.058 1.315 1.706 2.056 2.162 2.479 2.779 3.067 3.435 3.707 0.684 0.855 1.057 1.314 1.703 2.052 2.158 2.473 2.771 3.057 3.421 3.690 0.683 0.855 1.056 1.313 1.701 2.048 2.154 2.467 2.763 3.047 3.408 3.674 0.683 0.854 1.055 1.311 1.699 2.045 2.150 2.462 2.756 3.038 3.396 3.659 0.683 0.854 1.055 1.310 1.697 2.042 2.147 2.457 2.750 3.030 3.385 3.646 0.682 0.853 1.054 1.309 1.696 2.040 2.144 2.453 2.744 3.022 3.375 3.633 0.682 0.853 1.054 1.309 1.694 2.037 2.141 2.449 2.738 3.015 3.365 3.622 D.682 0.853 1.053 1.308 1.692 2.035 2.138 2.445 2.733 3.008 3.356 3.611 0.682 0.852 1.052 1.307 1.691 2.032 2.136 2.441 2.728 3.002 3.348 3.601 0.682 0.852 1.052 1.306 1.690 2.030 2.133 2.438 2.724 2.996 3.340 3.591 0.681 0.852 1.052 1.306 1.688 2.028 2.131 2.434 2.719 2.990 3.333 3.582 0.681 0.851 1.051 1.305 1.687 2.026 2.129 2.431 2.715 2.985 3.326 3.574 0.681 0.851 1.051 1.304 1.686 2.024 2.127 2.429 2.712 2.980 3.319 3.566 0.681 0.851 1.050 1.304 1.685 2.023 2.125 2.426 2.708 2.976 3.313 3.558 0.681 0.851 1.050 1.303 1.684 2.021 2.123 2.423 2.704 2.971 3.307 3.551 0.679 0.849 1.047 1.209 1.676 2.009 2.109 2.403 2.678 2.937 3.261 3.496 0.679 0.848 1.045 1.296 1.671 2.000 2.099 2.390 2.660 2.915 3.232 3.460 0.678 0.847 1.044 1.294 1.667 1.994 2.093 2.38 2.648 2.899 3.211 3.435 0.846 1.043 1.292 1.664 1.990 2.088 2.374 2.639 2.887 3.195 3.41670 0.678 0.847 1.044 1.294 1.667 1.994 2.093 2.381 2.648 2.899 3.211 3.435 80 0.678 0.846 1.043 1.292 1.664 1.990 2.088 2.374 2.639 2.887 3.195 3.416 90 0.677 0.846 1.042 1.291 1.662 1.987 2.084 2.368 2.632 2.878 3.183 3.402 100 0.677 0.845 1.042 1.290 1.660 1.984 2.081 2.364 2.626 2.871 3.174 3.390 1000 0.675 0.842 1.037 1.282 1.646 1:962 2.056 2.330 2.581 2.813 3.098 3.300 Z 0.674 0.842 1.036 1.282 1.645 1.960 2.054 2.326 2.576 2.807 3.090 3.291 Degrees of 0.25 0.20 0.15 0.10 0.05 0.025 0.02 0.01 0.005 0.0025 0.001 0.0005 Freedom t-Distribution Area in Right TailTo test H0: p. = 31 versus H1: p a! 31, a simple random sample of size n = 35 is obtained. Complete parts (a) through (f) below. === Click the icon to view the table of critical t-values. (a) Does the population have to be normally distributed to test this hypothesis by using t-distribution methods? Why? A. Yessince the sample size is at not least 50, the underlying population does not need to be normally distributed. B. Yesthe population must be normally distributed in all cases in order to perform a hypothesis test. 3'8. Nosince the sample size is at least 30, the underlying population does not need to be normally distributed. D. Nothere are no constraints in order to perform a hypothesis test. (b) If )_