Please help ASAP. I've asked my professor and my group and they are no help at all. Below are the instructions. I did the VARSARSTATS
Please help ASAP. I've asked my professor and my group and they are no help at all. Below are the instructions. I did the VARSARSTATS but don't know how to do the rest. ANSWER ALL OR DON'T ANSWER AT ALL. All I need help is filling out each of the charts, creating another column on the excel page (after question 3) and answering the questions.
My original hypothesis is that wind would have the most affect. I added screenshots of the excel spreadsheet with a link for just in case.
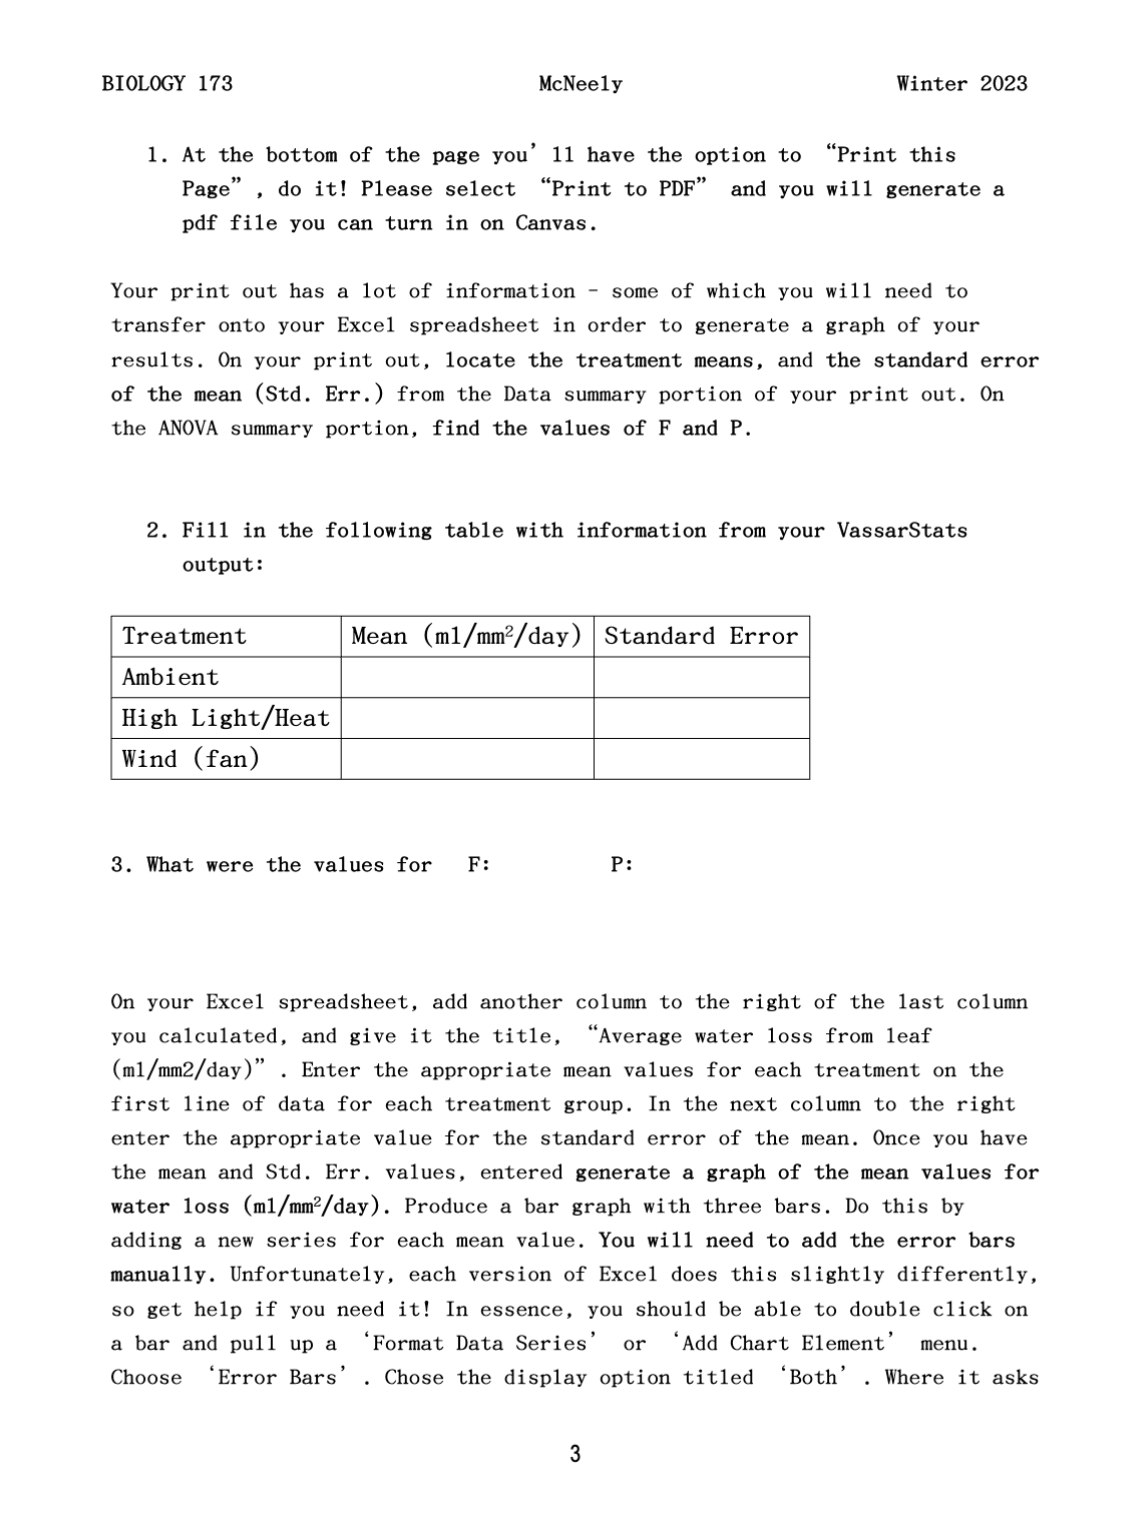
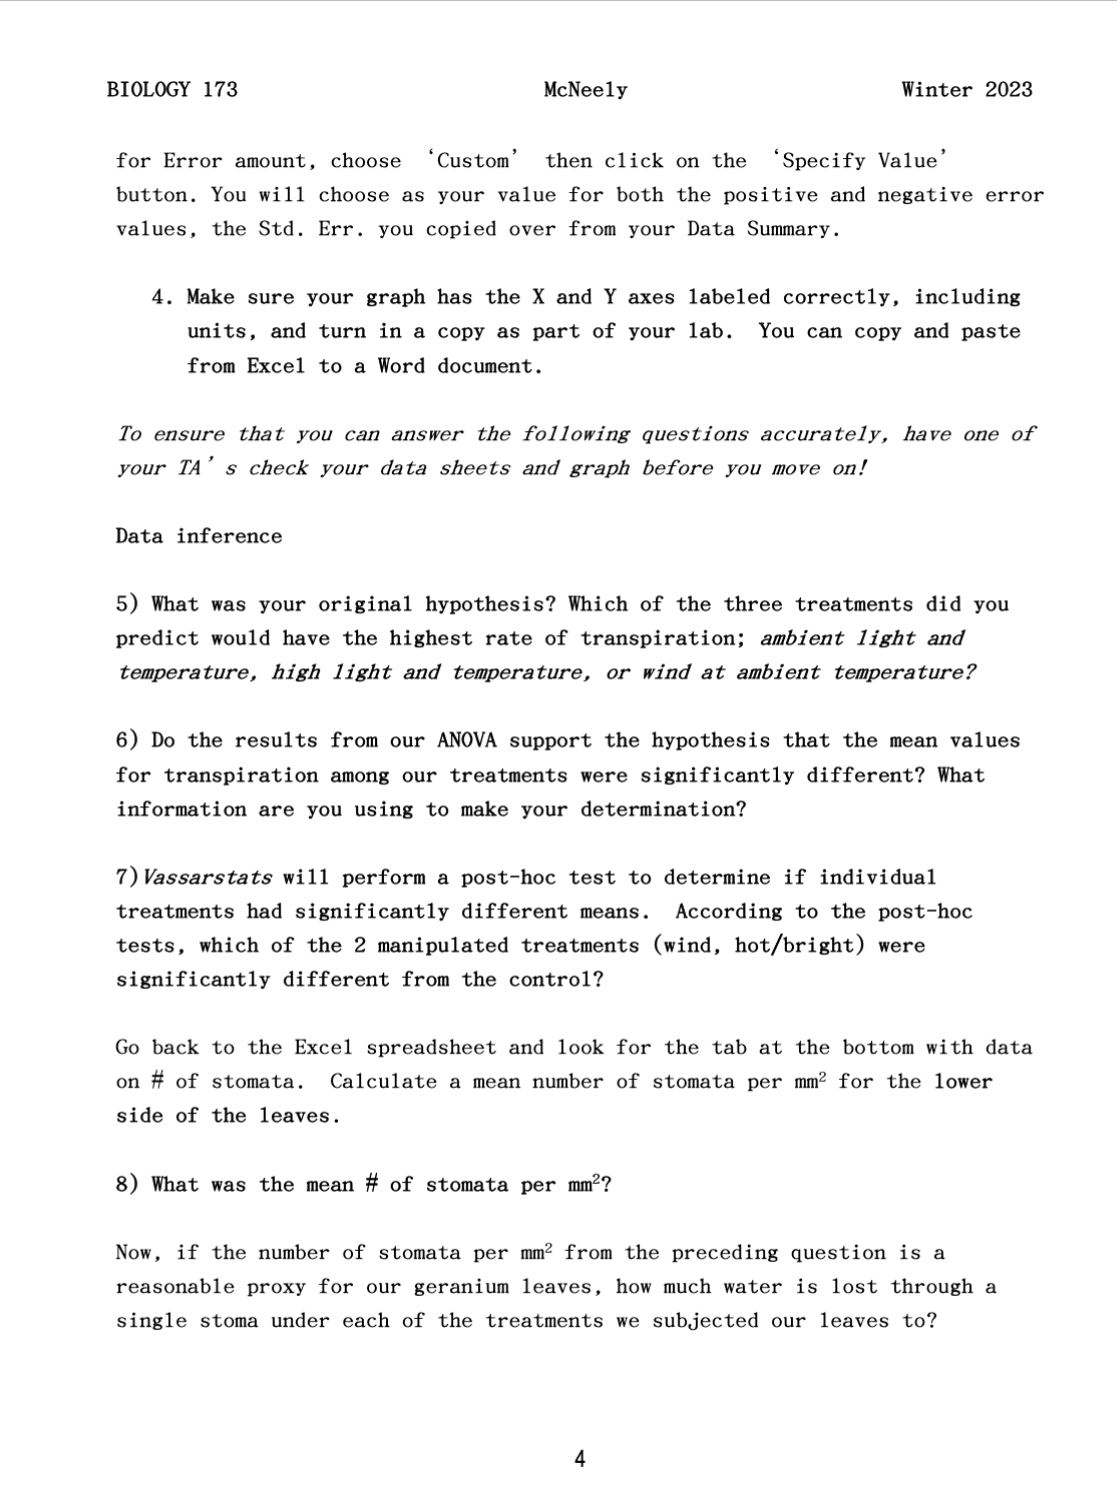
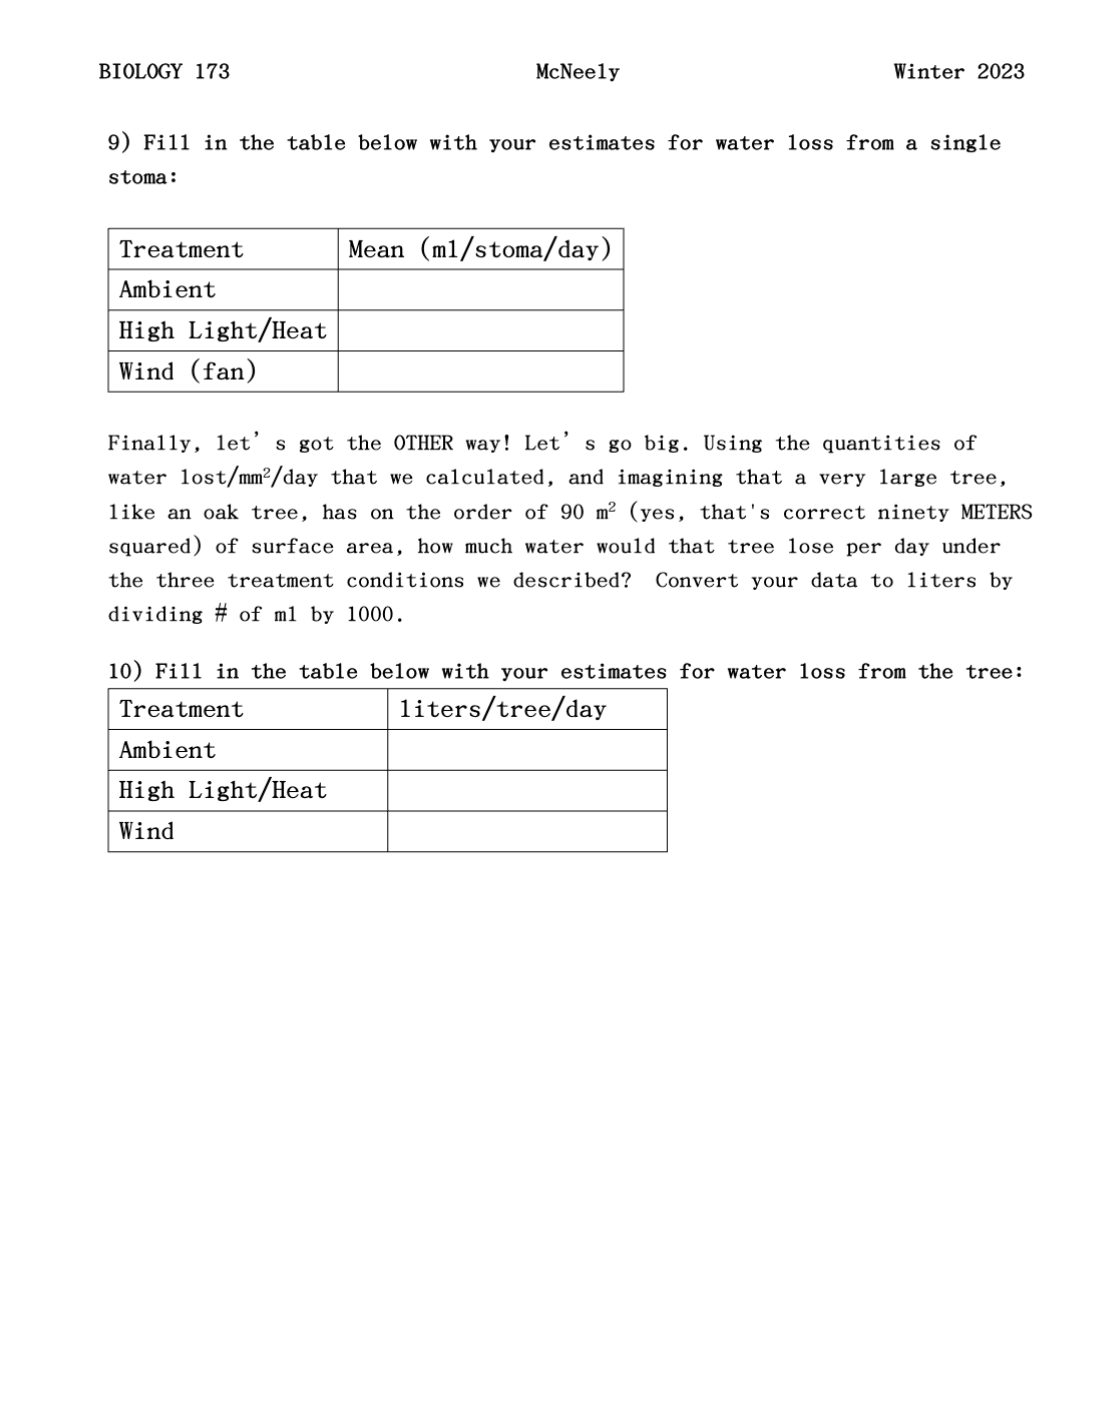
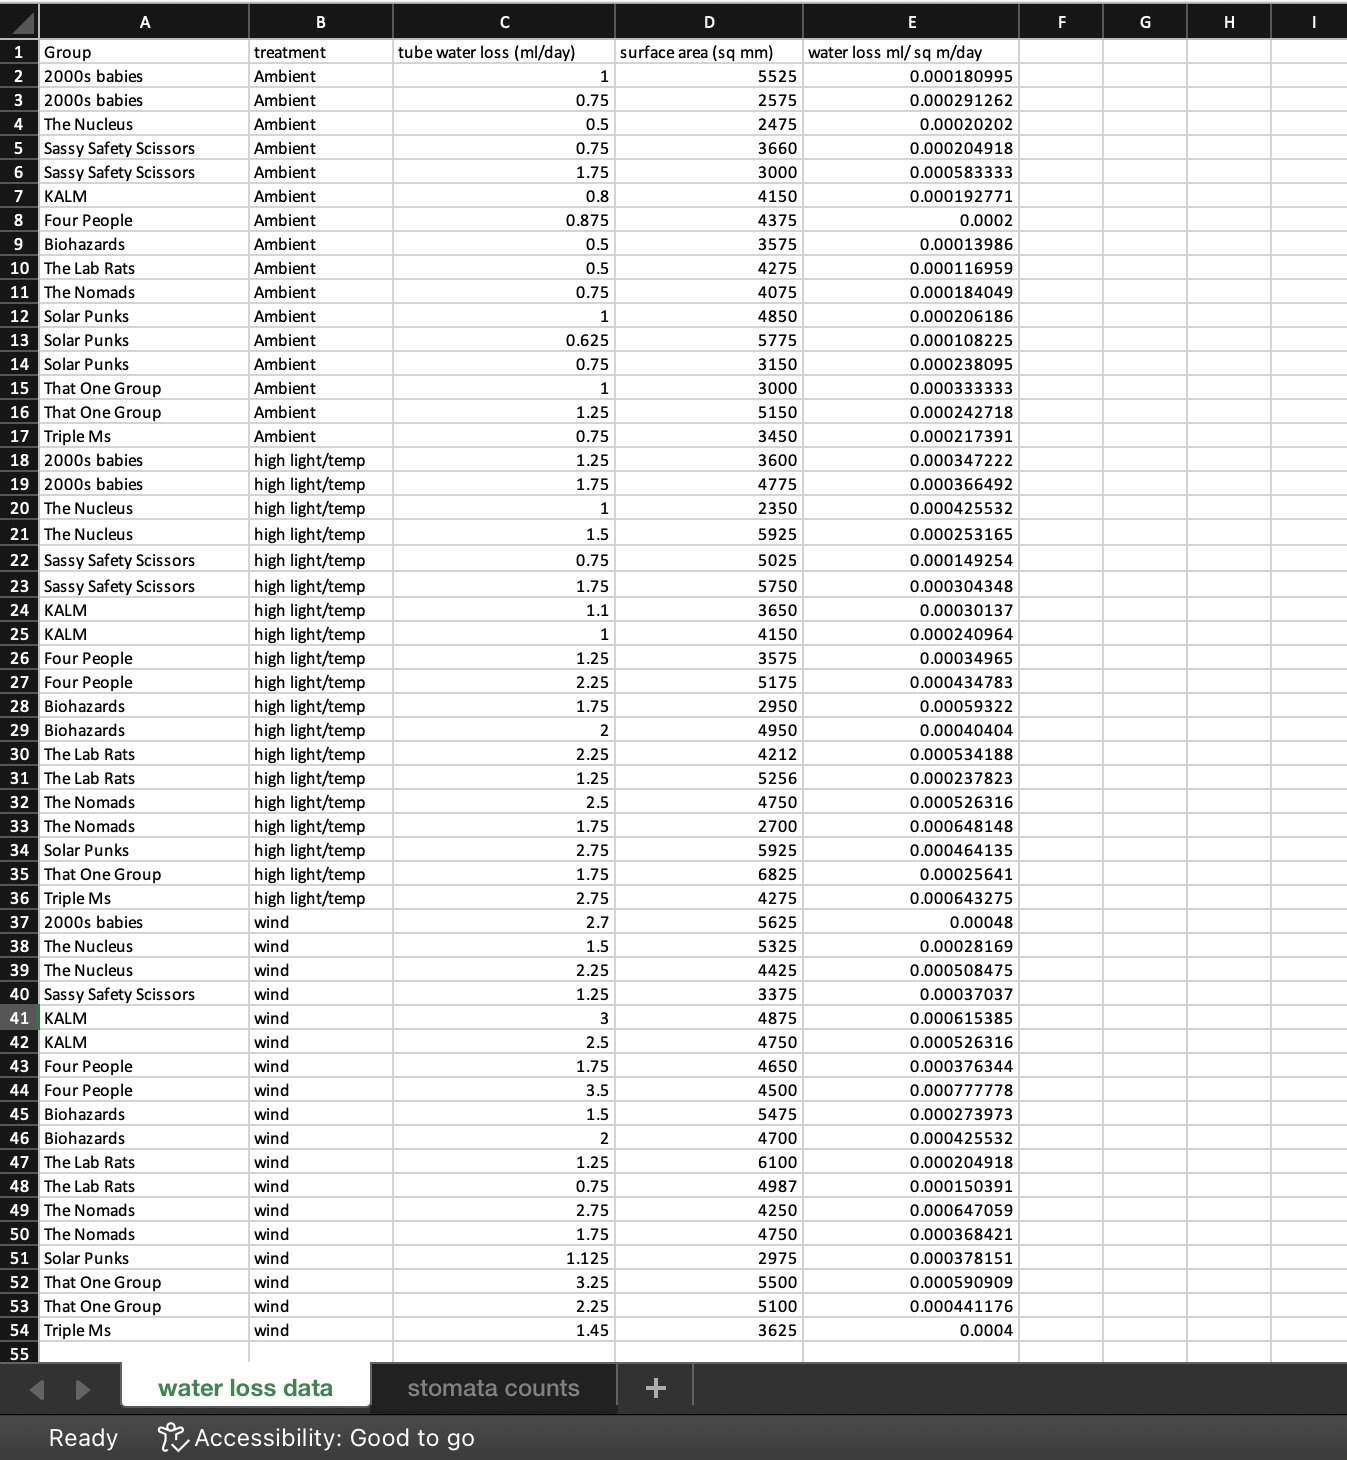
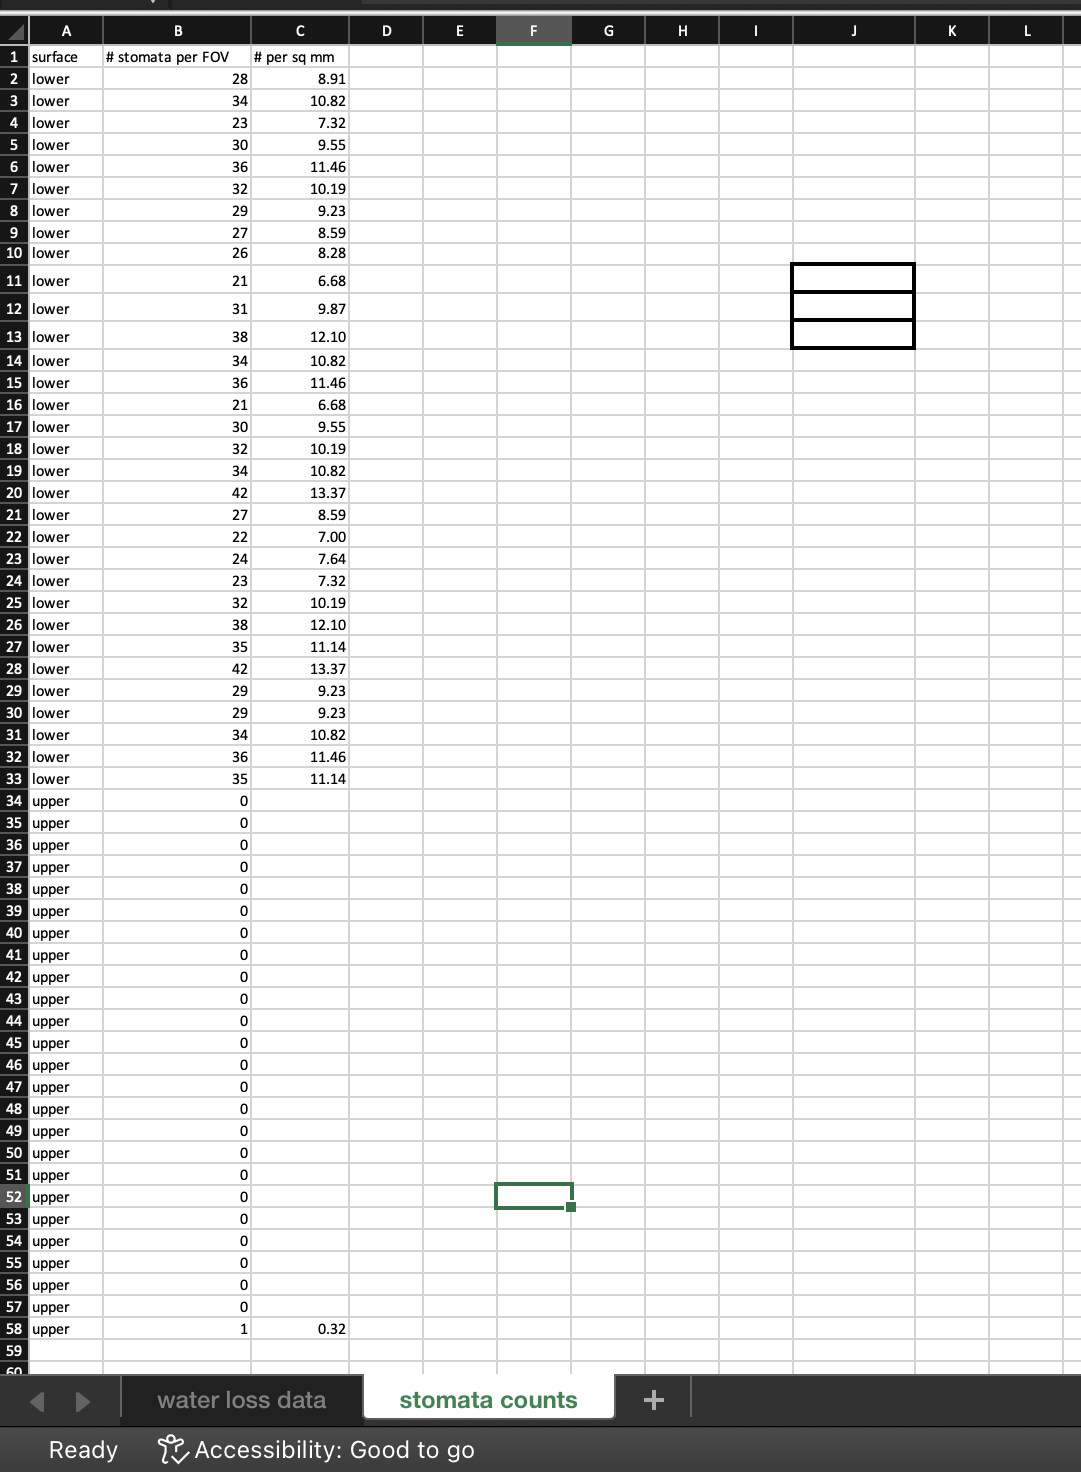
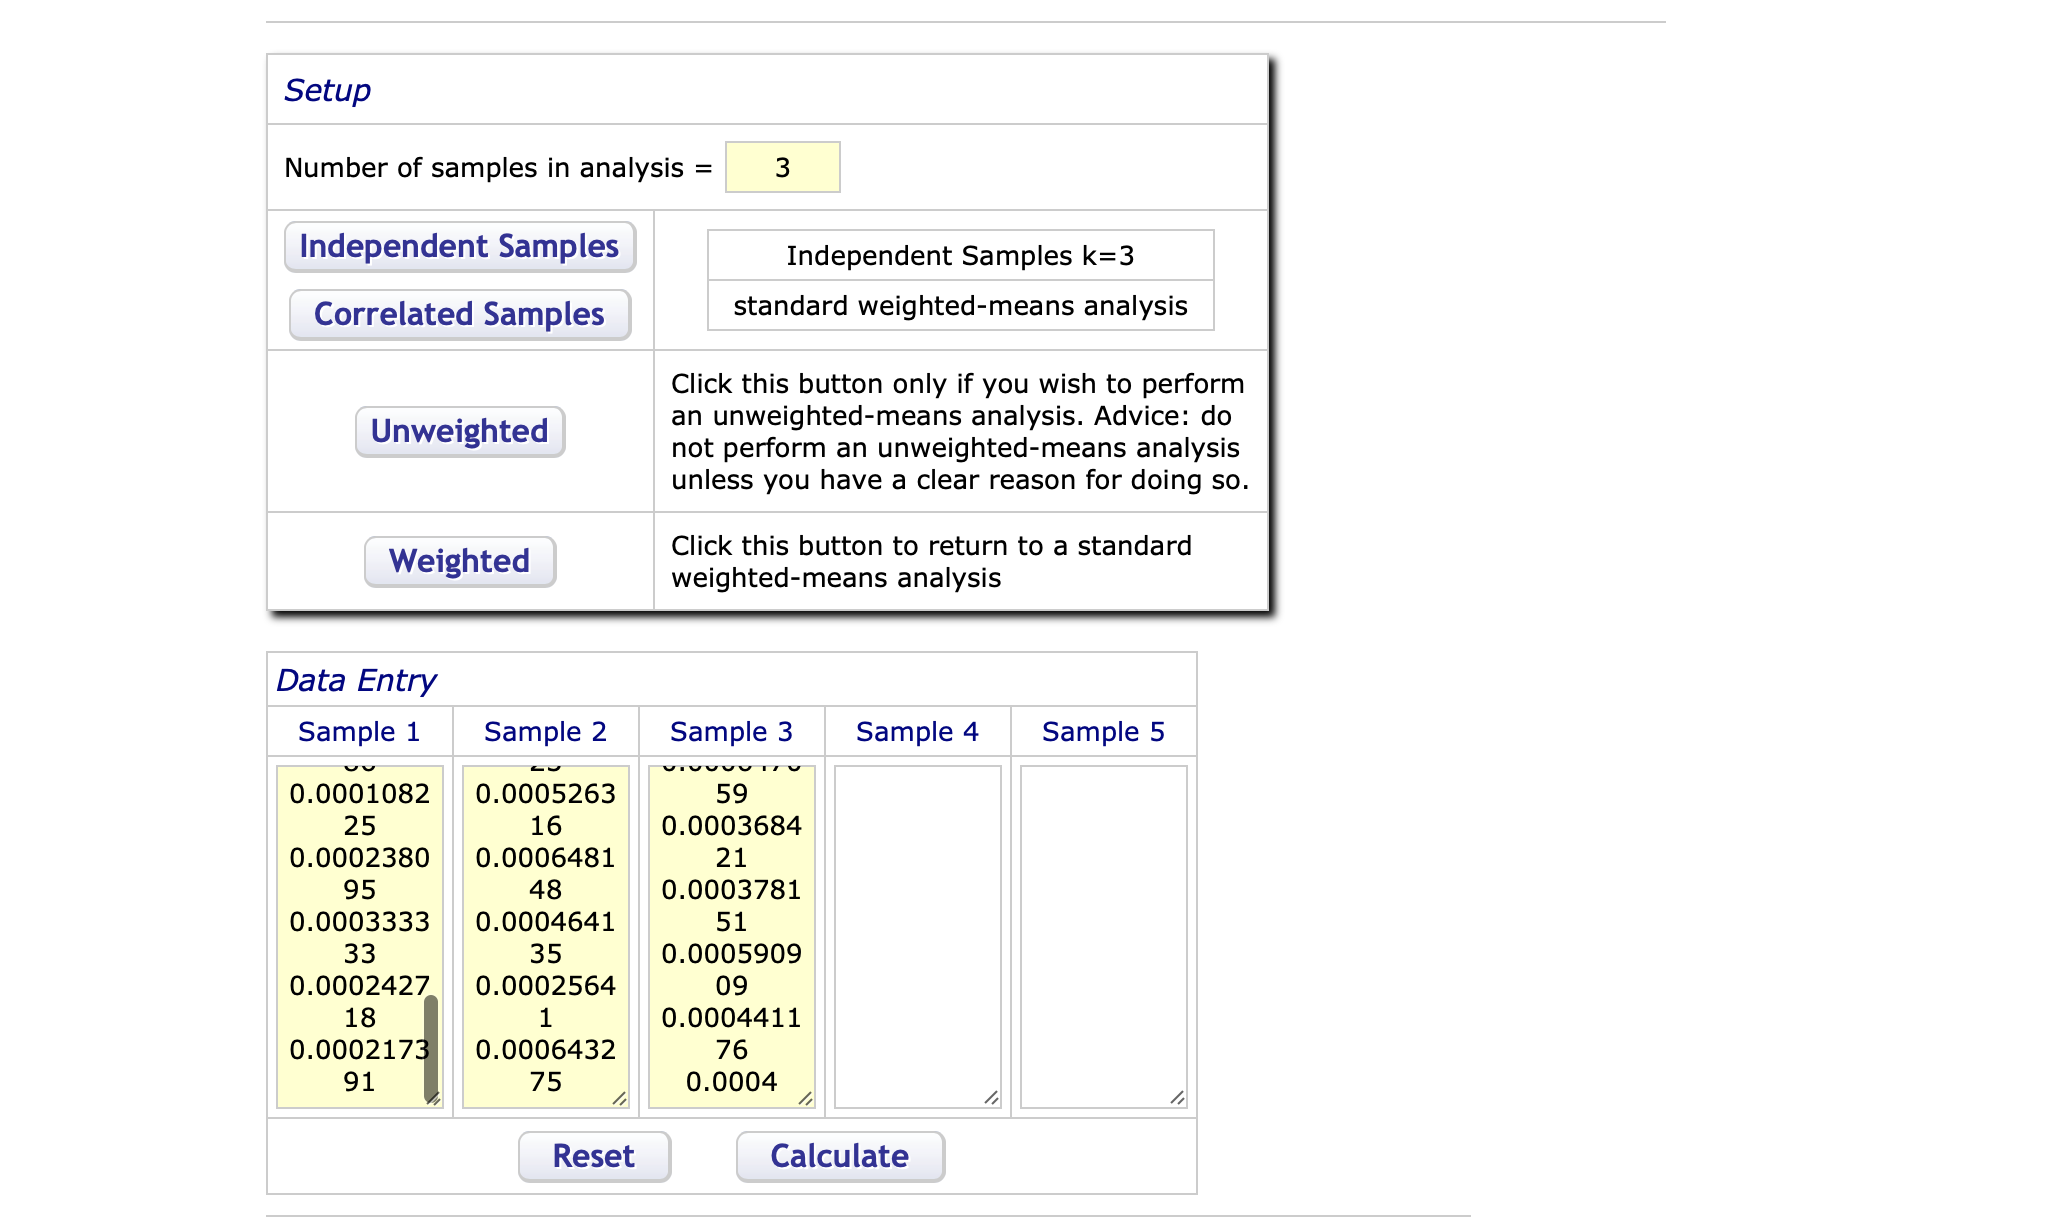
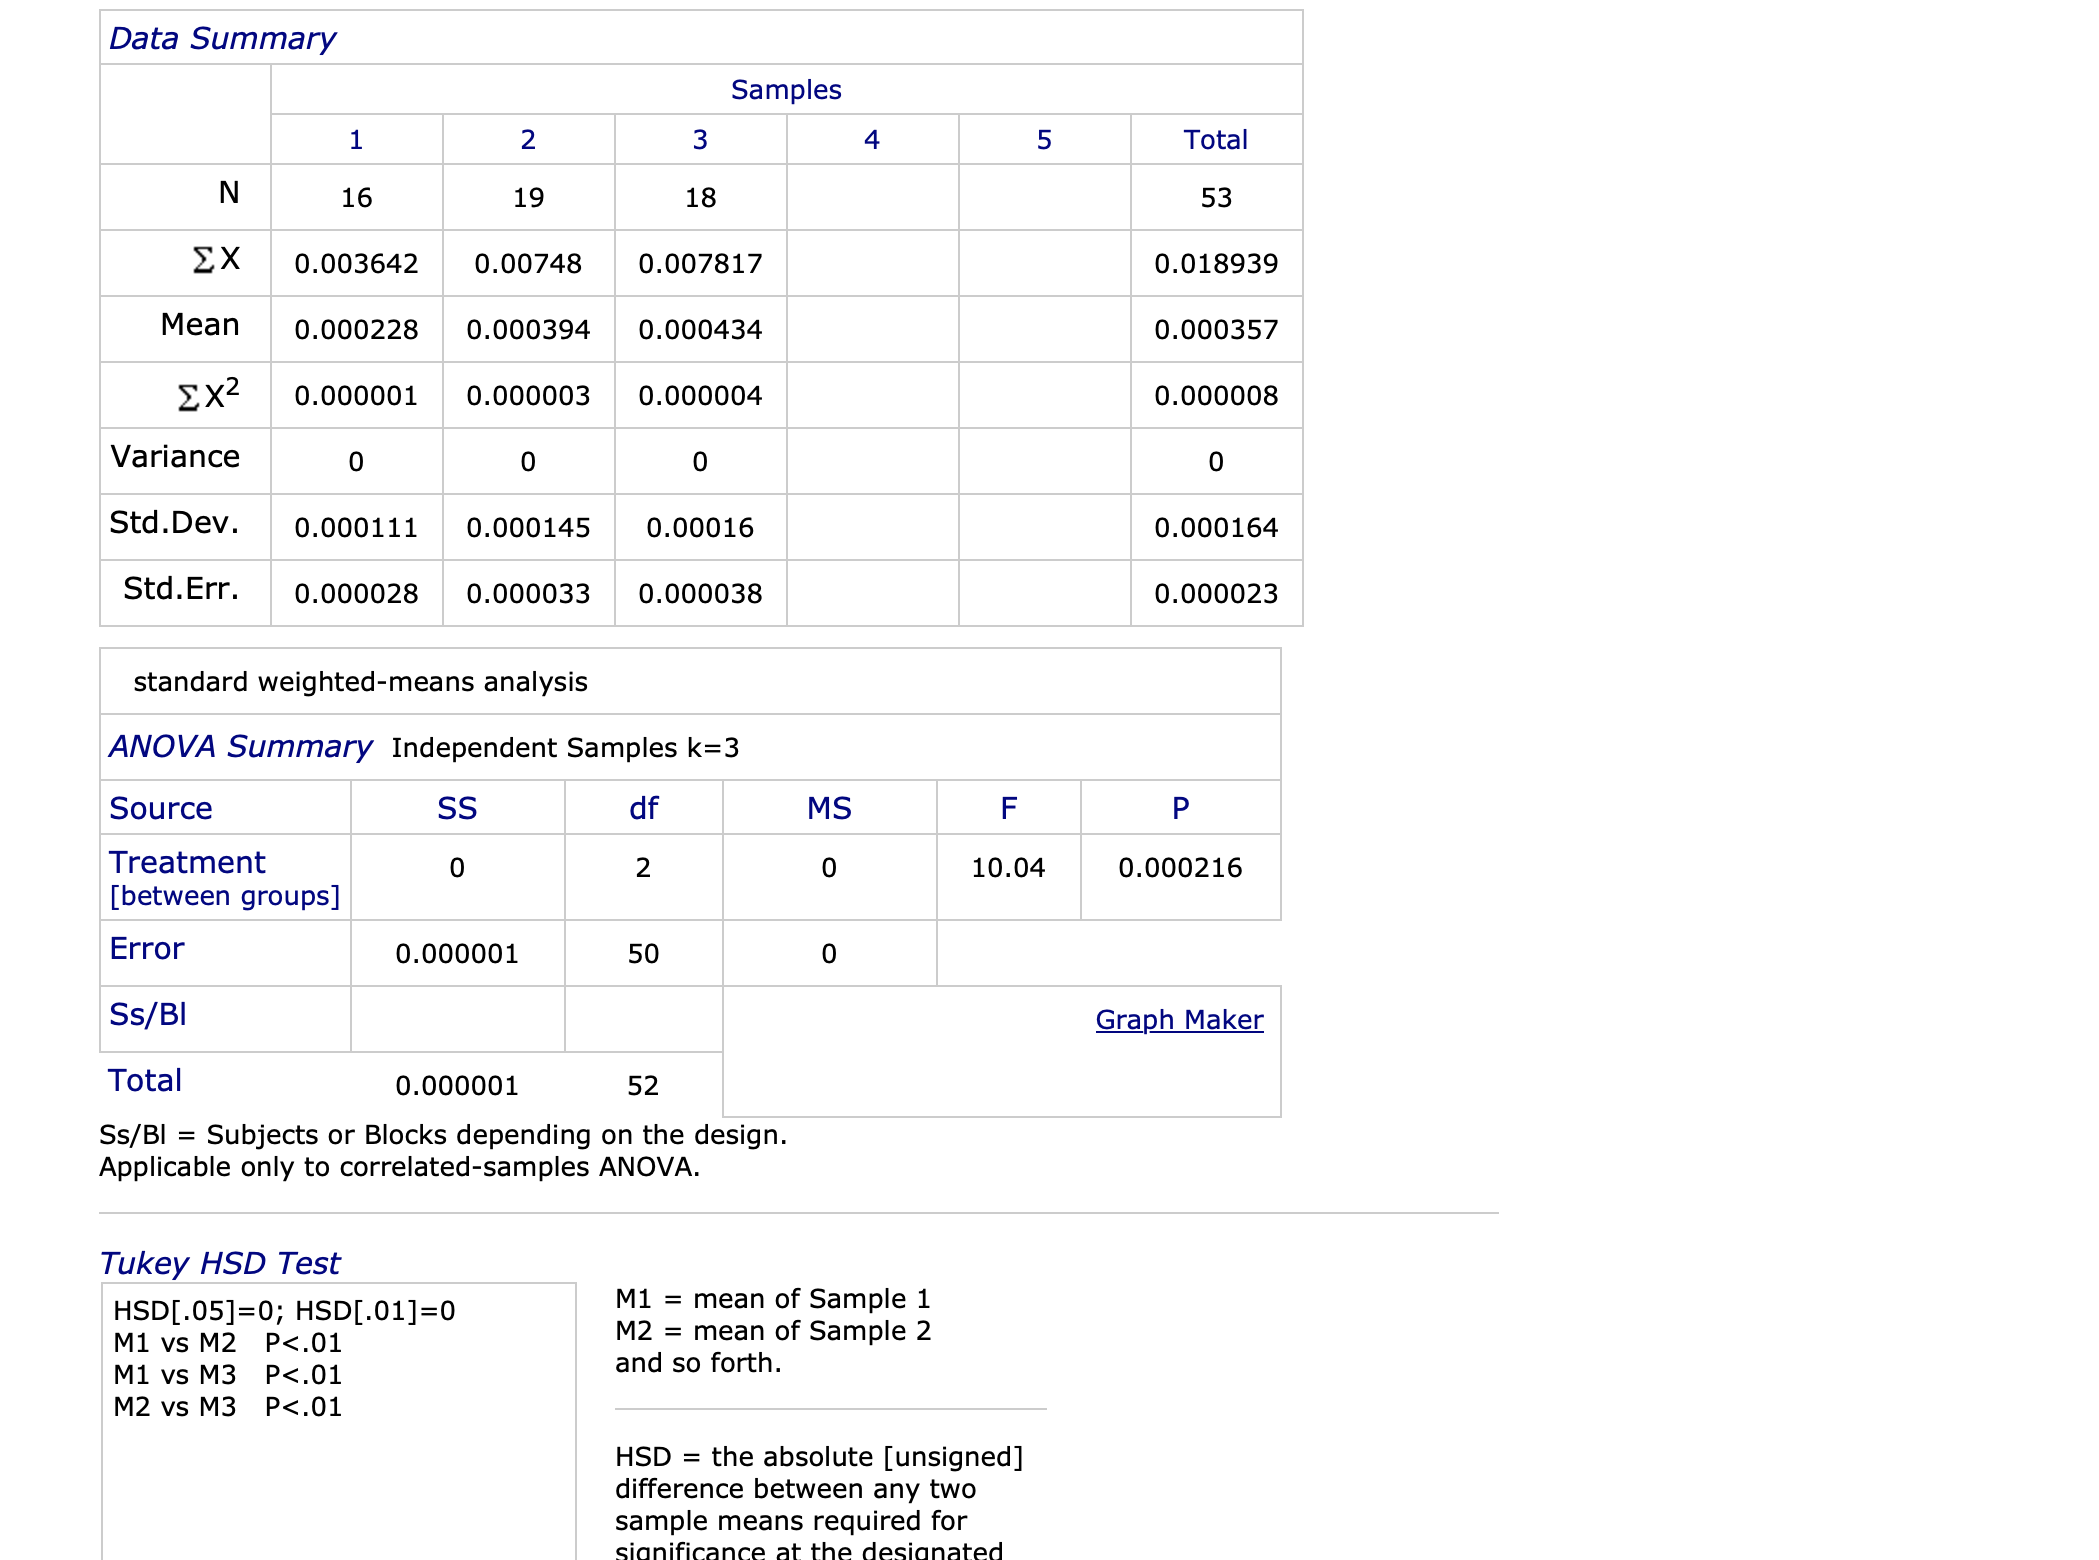
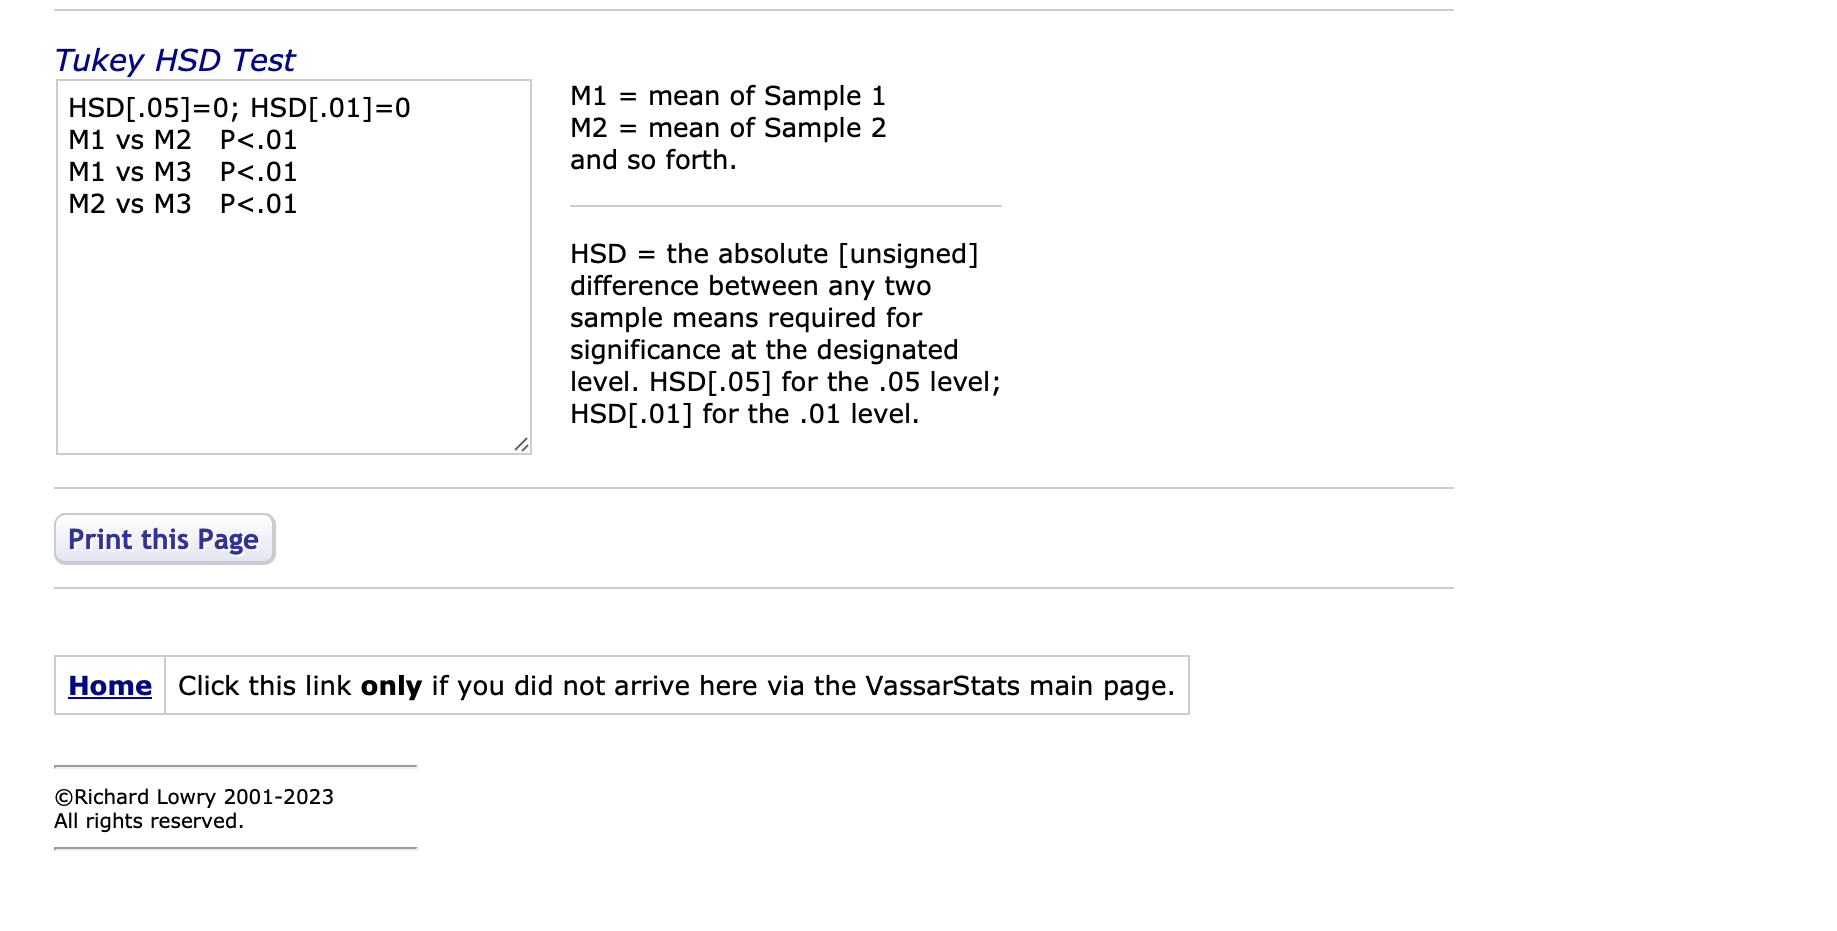
BIOLOGY 173 McNeely Winter 2023 Week #5 - Analysis of Transpiration Data DUE Weds, May 3. 9 am INDIVIDUAL ASSIGNMENT FTease monk with your group on analyses, graph, and calculations. However, your text answers should be your eon, and each person should turn in their own copy of the assignment. Please type your answers to the questions in bold and turn in via Canvas Objectives: 1. Evaluate factors affecting transpiration rates using data from last week, a lab 2. Estimate rates of transpiration at small (stoma) and large (tree) scales 3. Practice statistical hypothesis testing Recall from last week the conditions of our experiment We subjected mature leaves, cut from a geranium plant and placed into a tube of water, to the following conditions in the EWU greenhouse - o ambient light and temperature 0 high light and temperature 0 wind at ambient temperature for '48 hrs. After 48 hours, we measured how much water had been lost from each tube. Your first task today is to determine if any of these treatments resulted in greater loss of water through transpiration. Download a copy of the Excel spreadsheet with the transpiration data. We will conduct a statistical analysis to determine if our averaged values for each treatment are significantly different from what we d expect if our values were generated at random. The analysis we 11 do is called an Analysis of Variance, or ANOVA for short. An ANOVA compares the means from three or BIOLOGY 173 McNeely Winter 2023 more groups and tells us if those mean values are different as a result of our treatment effect. If they are, we 11 get a significant value for P, which is effectively the probability of us generating those values at random. In other words. the concept of significance. in statistical terms. means our values differ in a non-random way. To do this analysis, we 11 use a program available online. called HasserStats: bbsite for Statistical Cbmputation (http://vassarstats.netf). From the VasserStats webpage, choose ANOVA from the menu along the sidebar. Once you' ve opened the ANOVA link, you will choose the One-Way ANOVA for up to five samples link. Read through the procedure. Under the Setup window, put three in the first yellow box, for Number of samples in analysis. NOTE: the program is using the word 'sample" where we' ve been using the word \"treatment\" . We have three treatments so we 11 be comparing the three means from our three treatments. Click on Independent samples, which should generate text in the box to the right that reads, Independent Samples k = 3. This process will result in three yellow boxes in the Data Entry window. Enter the data from your "Water loss from leaf (ml/mmZ/day)\" column. Enter the data from the ambient treatment in the column titled Sample 1, data from high light/heat treatment in the Sample 2 column and data from the wind treatment in the Sample 3 column. It' s easiest to cut and paste the data from your excel spreadsheet, or you can enter the data manually. A quirk of this program is that when you cut and paste data it will add a "0\" to the values if you have a carriage return after the last data point. Make sure the cursor rests Just to the right of the last number in each column and not on a new row. If the cursor is in a new row, use the backspace to remove the extra row. This is described in the \"Data Check\" paragraph in the instructions at the top of the page. Once your data has been entered correctly, push Calculate. This action will conduct the analysis and generate a data summary and an ANOVA summary. BIOLOGY 173 McNeely Winter 2023 $ 1. At the bottom of the page you 11 have the option to \"Print this Page\" . do it! Please select \"Print to PDF\" and you will generate a pdf file you can turn in on Canvas. Your print out has a lot of information - some of which you will need to transfer onto your Excel spreadsheet in order to generate a graph of your results. On your print out. locate the treatment means. and the standard error of the mean (Std. Err.) from the Data summary portion of your print out. On the ANOVA summary portion, find the values of F and P. 2. Fill in the following table with information from your VassarStats output: Treatment Mean (ml/hmF/day) Standard Error Ambient 'High Light/Heat 'Wind (fan) ' 3. What were the values for F: P: On your Excel spreadsheet, add another column to the right of the last column you calculated. and give it the title. "Average water loss from leaf (ml/mmZ/day)\" . Enter the appropriate mean values for each treatment on the first line of data for each treatment group. In the next column to the right enter the appropriate value for the standard error of the mean. Once you have the mean and Std. Err. values, entered generate a graph of the mean values for water loss (ml/mmg/day). Produce a bar graph with three bars. Do this by adding a new series for each mean value. You will need to add the error bars manually. Unfortunately. each version of Excel does this slightly differently, so get help if you need it! In essence, you should be able to double click on a bar and pull up a 'Format Data Series. or 'Add Chart Element, menu. Choose 'Error Bars, . Chose the display option titled 'Both' . Where it asks BIOLOGY 173 McNeely Winter 2023 for Error amount, choose 'Custom' then click on the 'Specify Value' button. You will choose as your value for both the positive and negative error values, the Std. Err. you copied over from your Data Summary. 4. Make sure your graph has the X and Y axes labeled correctly, including units, and turn in a copy as part of your lab. You can copy and paste from EXcel to a Word document. In ensure that you can answer the fbiiowing questions accurately, have one of your 13' s check your data sheets and graph before you more on! Data inference 5) What was your original hypothesis? Which of the three treatments did you predict would have the highest rate of transpiration; ambient light and temperature, nign light and temperature, or wind at ambient temperature? 6) Do the results from our ANOVA support the hypothesis that the mean values for transpiration among our treatments were significantly different? What information are you using to make your determination? 7)Passarstats will perform a post-hoe test to determine if individual treatments had significantly different means. According to the post-hoc tests, which of the 2 manipulated treatments (wind, hot/bright) were significantly different from the control? Go back to the Excel spreadsheet and look for the tab at the bottom with data on # of stomata. Calculate a mean number of stomata per mm? for the lower side of the leaves. 8) What was the mean # of stomata per mmz? Now, if the number of stomata per mm2 from the preceding question is a reasonable proxy for our geranium leaves, how much water is lost through a single stoma under each of the treatments we subjected our leaves to? BIOLOGY 173 McNeelY Winter 2023 9) Fill in the table below with your estimates for water loss from a single stoma: 'Treatment Mean (ml/stoma/day) Ambient (ran) Finally. let, s got the OTHER way! Let, 5 go big. Using the quantities of water lost/mmZ/day that we calculated, and imagining that a very large tree, like an oak tree, has on the order of 90 m2 (yes, that's correct ninety METERS squared) of surface area, how much water would that tree lose per day under the three treatment conditions we described? Convert your data to liters by dividing # of ml by 1000. 10) Fill in the table below with your estimates for water loss from the tree: Wind B D G H Group treatment tube water loss (ml/day) surface area (sq mm) water loss ml/ sq m/day 2000s babies Ambient 1 5525 0.000180995 2000s babies Ambient 0.75 2575 0.000291262 The Nucleus Ambient 0.5 2475 0.00020202 Sassy Safety Scissors Ambient 0.75 3660 0.000204918 Sassy Safety Scissors Ambient 1.75 3000 0.000583333 KALM Ambient 0.8 4150 0.000192771 8 Four People Ambient ).875 4375 0.0002 9 hazards Ambient 0.5 3575 0.00013986 10 The Lab Rats Ambien 0.5 4275 0.000116959 The Nomads Ambient 0.75 4075 .000184049 Solar Punk Ambient 4850 0.000206186 Solar Punks Ambient 0.625 5775 0.000108225 Solar Punks Ambient 0.75 3150 0.00023809 5 That One Group Ambient 3000 .000333333 That One Group Ambient 1.25 5150 0.000242718 7 Triple Ms Ambient 0.7 3450 0.000217391 18 2000s babies high light/temp 1.25 3600 0.000347222 2000s babies high light/temp 1.75 4775 0.000366492 20 The Nucleus high light/temp 2350 0.000425532 1 The Nucleus high light/temp 1.5 5925 0.000253165 22 Sassy Safety Scissors high light/temp 0.75 5025 0.000149254 23 Sassy Safety Scissors high light/temp 1.75 5750 .000304348 KALM high light/temp 1.1 3650 0.00030137 25K high light/temp 1 4150 0.000240964 Four People high light/temp 1.25 3575 0.00034965 27 Four People high light/temp 2.25 5175 0.000434783 28 Biohazard high light/temp 1.75 2950 0.00059322 29 Biohazards high light/temp 2 4950 0.00040404 30 The Lab Rats high light/temp 2.25 4212 0.000534188 31 The Lab Rats high light/temp 1.25 5256 0.000237823 2 The Nomads high light/temp 2.5 4750 0.000526316 33 The Nomads high light/temp 1.75 2700 0.000648148 34 Solar Punks high light/temp 2.75 5925 0.000464135 35 That One Group high light/temp 1.75 6825 0.00025641 36 Triple Ms high light/temp 2.75 4275 0.000643275 37 2000s babies wind 2.7 5625 0.00048 38 The Nucleus wind 1.5 5325 0.0002816 39 The Nucleus wind 2.25 1425 0.000508475 40 Sassy Safety Scissors wind 1.25 8375 0.00037037 41 KALM wind 3 4875 0.000615385 42 KALM wind 2.5 4750 .000526316 43 Four People wind 1.75 4650 0.000376344 44 Four People wind 3.5 4500 0.000777778 45 Biohazards wind 1.5 5475 0.000273973 46 Biohazards wind 2 4700 0.000425532 47 The Lab Rats wind 1.25 5100 0.000204918 18 The Lab Rats wind 0.75 4987 0.000150391 9 The Nomad: wind 2.75 4250 0.000647059 50 The Nomads wind 1.75 4750 0.000368421 51 Solar Punks wind 1.125 2975 0.000378151 52 That One Group wind 3.25 5500 0.000590909 3 That One Group wind 2.25 5100 0.000441176 54 Triple M wind 1.45 3625 0.0004 55 water loss data stomata counts + Ready Accessibility: Good to gosurface 3': stomata per FOV 3': per sq mm I A B C D E F G H | .I K L 1 2 lower 28 8.91 3 lower 34 10.82 4 lower 23 2.32 5 lower 30 9.55 6 lower 35 11.45 2 lower 32 10.19 8 lower 29 9.23 9 lower 22 8.59 10 lower 25 8.28 11 lower 21 5.58 12 lower 31 9.82 13 lower 38 12.10 14 lower 34 10.82 15 lower 35 11.45 16 lower 21 5.58 12 lower 30 9.55 18 lower 32 10.19 19 lower 34 10.82 20 lower 42 13.32 21 lower 22 8.59 22 lower 22 2.00 23 lower 24 2.54 24- lower 23 2.32 25 lower 32 10.19 26 lower 38 12.10 22 lower 35 11.14 28 lower 42 13.32 29 lower 29 9.23 30 lower 29 9.23 31 lower 34 10.82 32 lower 35 11.45 33 lower 35 11.14 34 upper 0 35 upper 0 36 upper 0 32 upper 0 38 upper 0 39 upper 0 40 upper 0 41 upper 0 42 upper 0 43 upper 0 44 upper 0 45 upper 0 46 upper 0 42 upper 0 48 upper 0 49 upper 0 50 upper 0 51 upper 0 52 upper 0 I ll 53 upper 0 54 upper 0 55 upper 0 56 upper 0 52 upper 0 58 upper 1 0.32 stomata counts Ready cKP,Accessibility: Good to go Setup Number of samples in analysis = 3 Independent samples Independent Samples k=3 Correlated Samples standard weighted-means analysis Click this button only if you wish to perform an unweighted-means analysis. Advice: do Unwelghted not perform an unweightedmeans analysis unless you have a clear reason for doing so. Weighted Click this button to return to a standard weighted-means analysis Data Entry Sample 1 Sample 2 Sample 3 Sample 4 Sample 5 0.0001082 0.0005263 59 25 16 0.0003684 0.0002380 0.0006481 21 95 48 0.0003781 0.0003333 0.0004641 51 33 35 0.0005909 0.0002427 0.0002564 09 18 1 0.0004411 0.000217 0.0006432 76 91 75 0.0004 1 l, l, A 4 Reset Calculate Data Summary Samples 1 2 3 4 5 Total N 16 19 18 53 EX 0.003642 0.00748 0.007817 0.018939 Mean 0.000228 0.000394 0.000434 0.000357 EX2 0.000001 0.000003 0.000004 0.000008 Variance 0 0 Std. Dev. 0.000111 0.000145 0.00016 0.000164 Std. Err. 0.000028 0.000033 0.000038 0.000023 standard weighted-means analysis ANOVA Summary Independent Samples k=3 Source SS df MS F P Treatment 0 2 0 10.04 0.000216 [between groups] Error 0.000001 50 0 Ss/BI Graph Maker Total 0.000001 52 Ss/BI = Subjects or Blocks depending on the design. Applicable only to correlated-samples ANOVA. Tukey HSD Test HSD[.05]=0; HSD[.01]=0 M1 = mean of Sample 1 M1 vs M2 P<.01 m2="mean" of sample m1 vs m3 p and so forth. hsd="the" absolute difference between any two means required fortukey test for significance at the designated level. .05 level .01 print this page home click link only if you did not arrive here via vassarstats main page. richard lowry all rights reserved>
Step by Step Solution
There are 3 Steps involved in it
Step: 1
Get Instant Access to Expert-Tailored Solutions
See step-by-step solutions with expert insights and AI powered tools for academic success
Step: 2
Step: 3
Ace Your Homework with AI
Get the answers you need in no time with our AI-driven, step-by-step assistance