PLEASE HELP ASAP. USE MATLAB TO PLOT and include scripts in solution. USE MATLAB in parts b,c, and d and include script in solution.
Do not forget to mention how can we describe reactor stability.
Question: Show which initial conditions are attracted to which solutions in figure 6.30. Table 6.3 and fig 6.30 are below for reference.
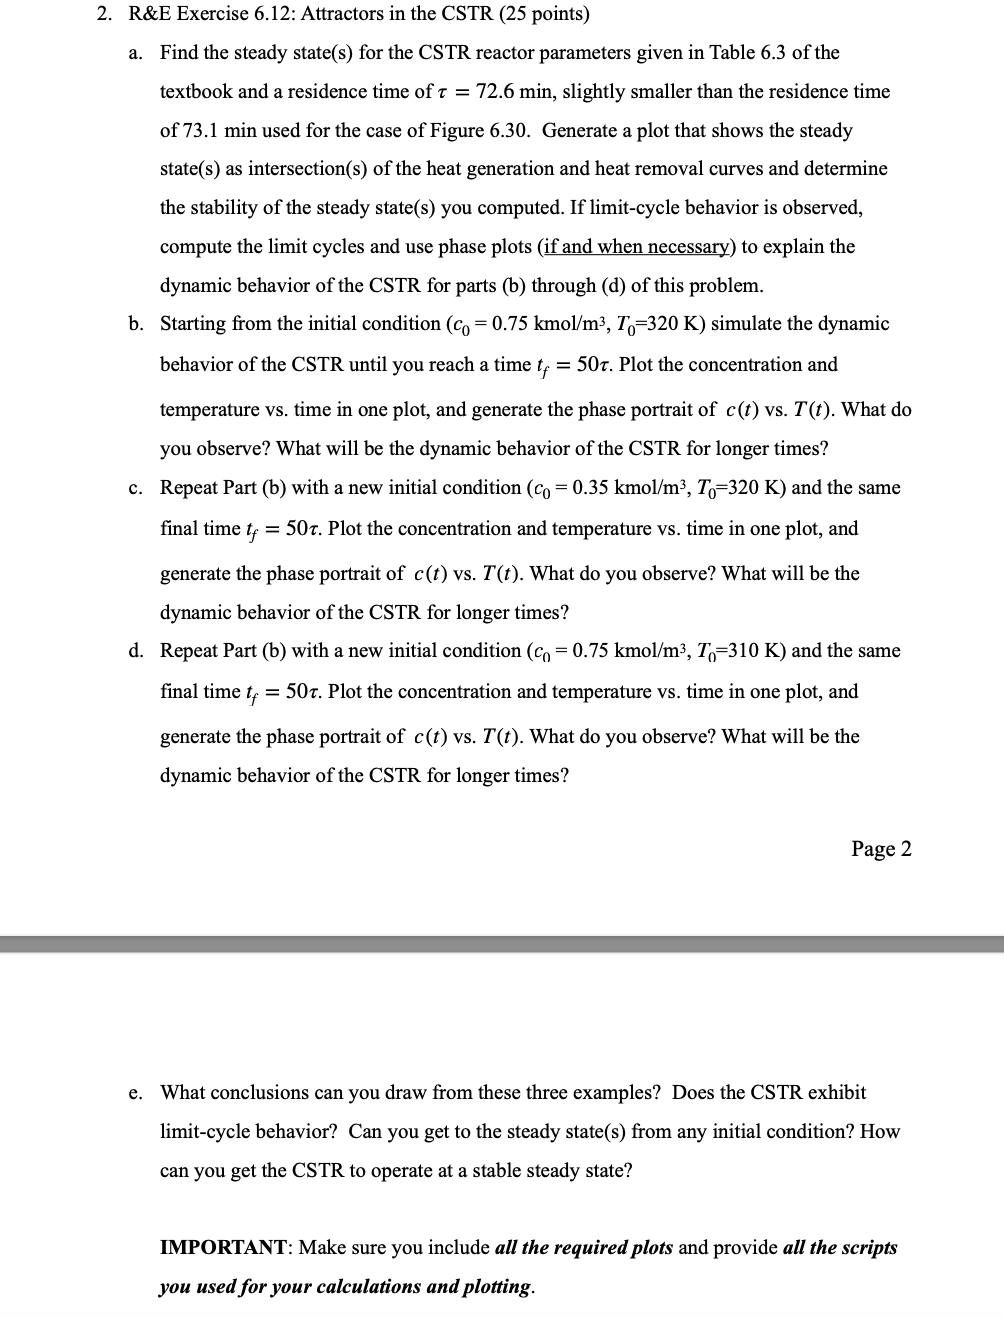
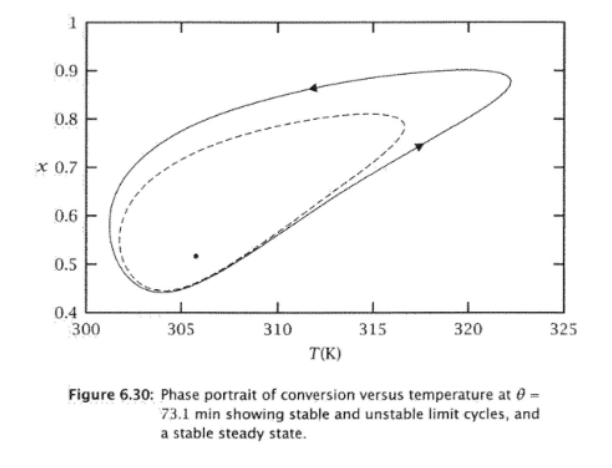
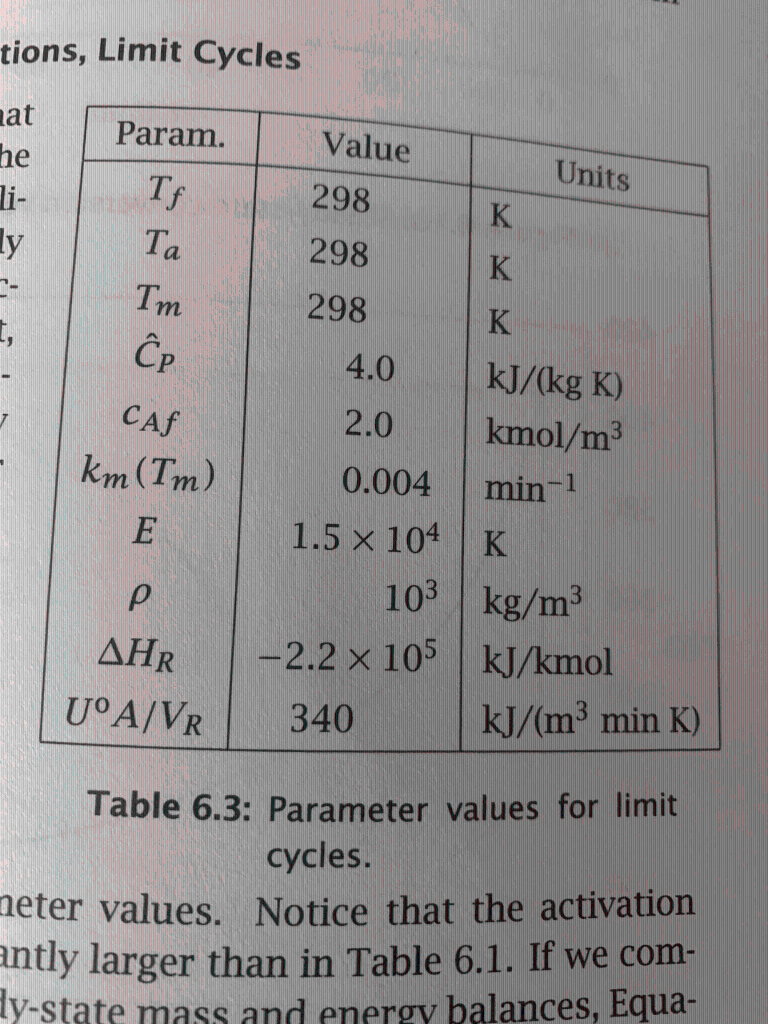
a. Find the steady state(s) for the CSTR reactor parameters given in Table 6.3 of the textbook and a residence time of =72.6min, slightly smaller than the residence time of 73.1 min used for the case of Figure 6.30. Generate a plot that shows the steady state(s) as intersection(s) of the heat generation and heat removal curves and determine the stability of the steady state(s) you computed. If limit-cycle behavior is observed, compute the limit cycles and use phase plots (if and when necessary) to explain the dynamic behavior of the CSTR for parts (b) through (d) of this problem. b. Starting from the initial condition (c0=0.75kmol/m3,T0=320K) simulate the dynamic behavior of the CSTR until you reach a time tf=50. Plot the concentration and temperature vs. time in one plot, and generate the phase portrait of c(t) vs. T(t). What do you observe? What will be the dynamic behavior of the CSTR for longer times? c. Repeat Part (b) with a new initial condition (c0=0.35kmol/m3,T0=320K) and the same final time tf=50. Plot the concentration and temperature vs. time in one plot, and generate the phase portrait of c(t) vs. T(t). What do you observe? What will be the dynamic behavior of the CSTR for longer times? d. Repeat Part (b) with a new initial condition (c0=0.75kmol/m3,T0=310K) and the same final time tf=50. Plot the concentration and temperature vs. time in one plot, and generate the phase portrait of c(t) vs. T(t). What do you observe? What will be the dynamic behavior of the CSTR for longer times? Page 2 e. What conclusions can you draw from these three examples? Does the CSTR exhibit limit-cycle behavior? Can you get to the steady state(s) from any initial condition? How can you get the CSTR to operate at a stable steady state? IMPORTANT: Make sure you include all the required plots and provide all the scripts you used for your calculations and plotting. Figure 6.30: Phase portrait of conversion versus temperature at = 73.1 min showing stable and unstable limit cycles, and a stable steady state. tions, Limit Cycles Table 6.3: Parameter values for limit cycles. values. Notice that the activation antly larger than in Table 6.1. If we com- a. Find the steady state(s) for the CSTR reactor parameters given in Table 6.3 of the textbook and a residence time of =72.6min, slightly smaller than the residence time of 73.1 min used for the case of Figure 6.30. Generate a plot that shows the steady state(s) as intersection(s) of the heat generation and heat removal curves and determine the stability of the steady state(s) you computed. If limit-cycle behavior is observed, compute the limit cycles and use phase plots (if and when necessary) to explain the dynamic behavior of the CSTR for parts (b) through (d) of this problem. b. Starting from the initial condition (c0=0.75kmol/m3,T0=320K) simulate the dynamic behavior of the CSTR until you reach a time tf=50. Plot the concentration and temperature vs. time in one plot, and generate the phase portrait of c(t) vs. T(t). What do you observe? What will be the dynamic behavior of the CSTR for longer times? c. Repeat Part (b) with a new initial condition (c0=0.35kmol/m3,T0=320K) and the same final time tf=50. Plot the concentration and temperature vs. time in one plot, and generate the phase portrait of c(t) vs. T(t). What do you observe? What will be the dynamic behavior of the CSTR for longer times? d. Repeat Part (b) with a new initial condition (c0=0.75kmol/m3,T0=310K) and the same final time tf=50. Plot the concentration and temperature vs. time in one plot, and generate the phase portrait of c(t) vs. T(t). What do you observe? What will be the dynamic behavior of the CSTR for longer times? Page 2 e. What conclusions can you draw from these three examples? Does the CSTR exhibit limit-cycle behavior? Can you get to the steady state(s) from any initial condition? How can you get the CSTR to operate at a stable steady state? IMPORTANT: Make sure you include all the required plots and provide all the scripts you used for your calculations and plotting. Figure 6.30: Phase portrait of conversion versus temperature at = 73.1 min showing stable and unstable limit cycles, and a stable steady state. tions, Limit Cycles Table 6.3: Parameter values for limit cycles. values. Notice that the activation antly larger than in Table 6.1. If we com