

Answered step by step
Verified Expert Solution
Question
1 Approved Answer
please help C Spreadsheet Exercise: Chapter 3 The income statement and balance sheet are the primary reports that a firm constructs for use by management
please help 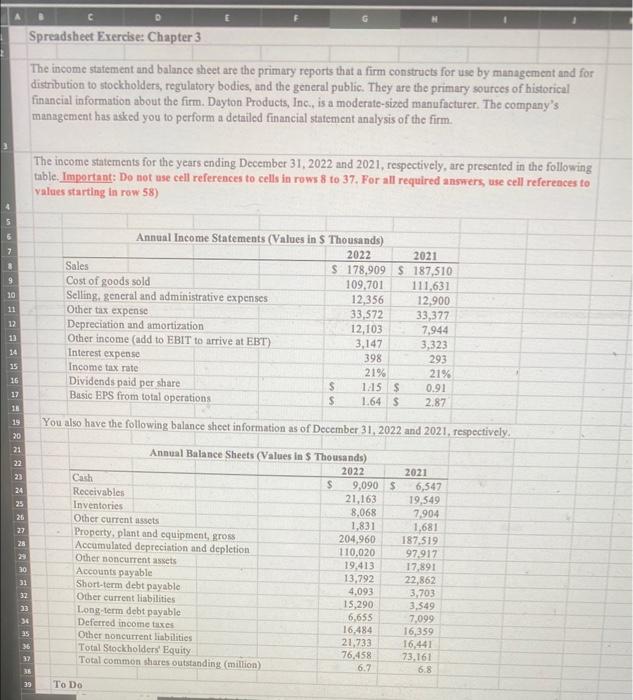
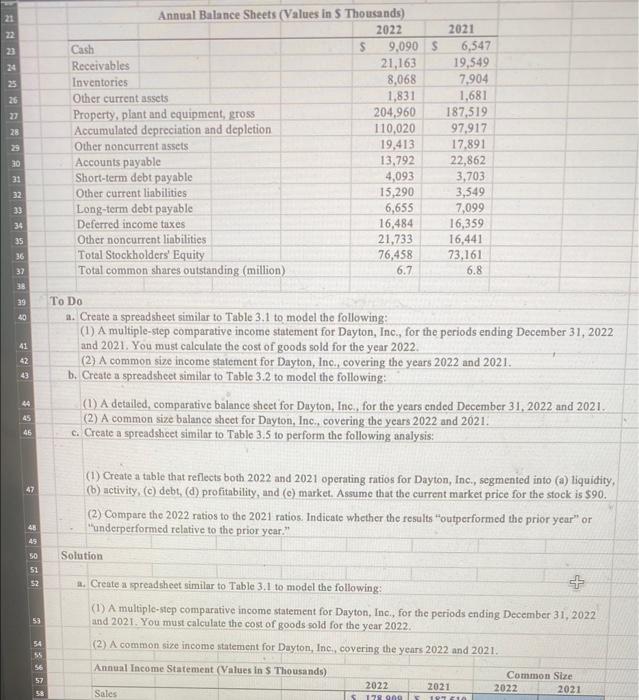
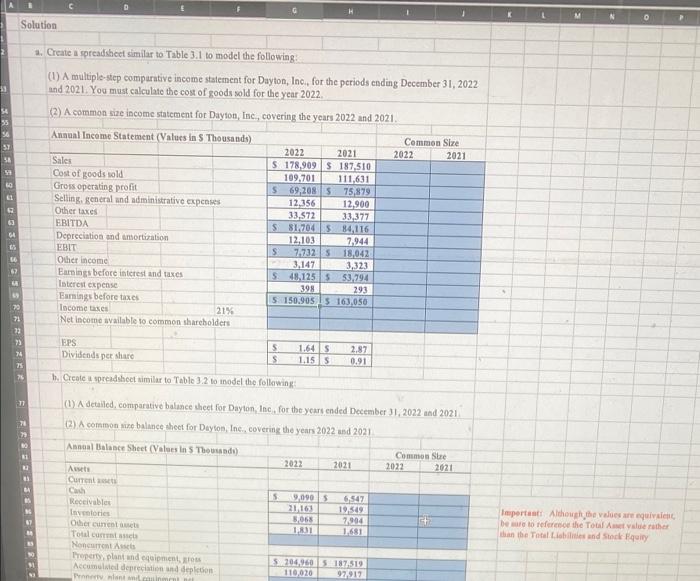
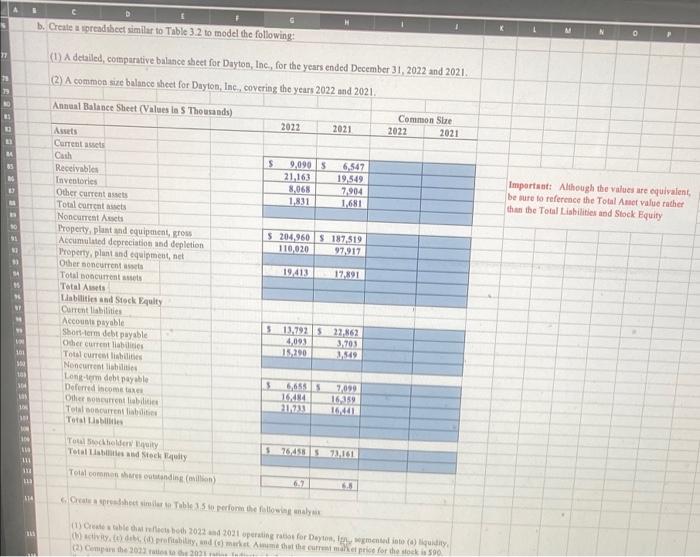
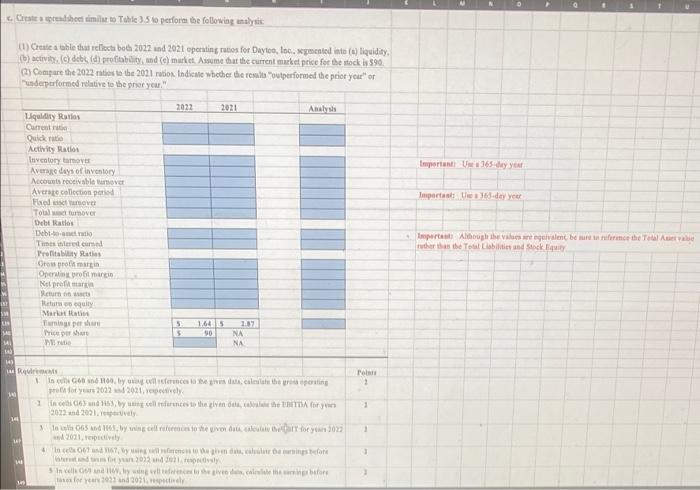
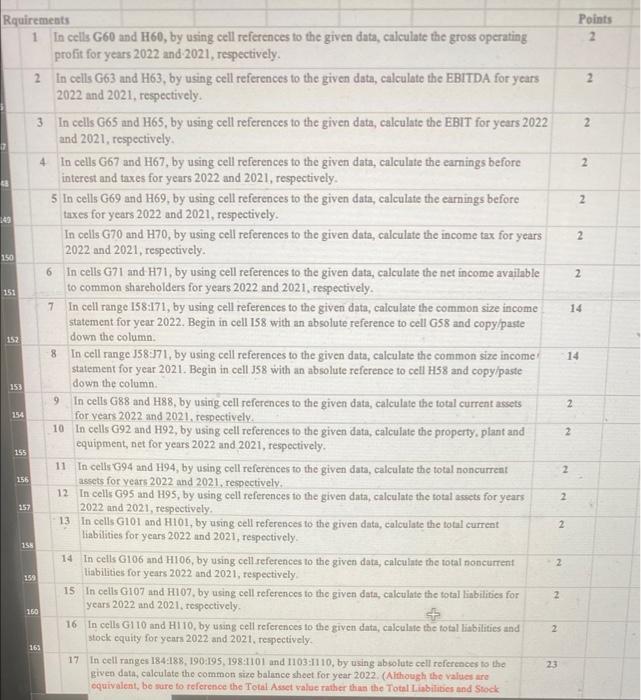
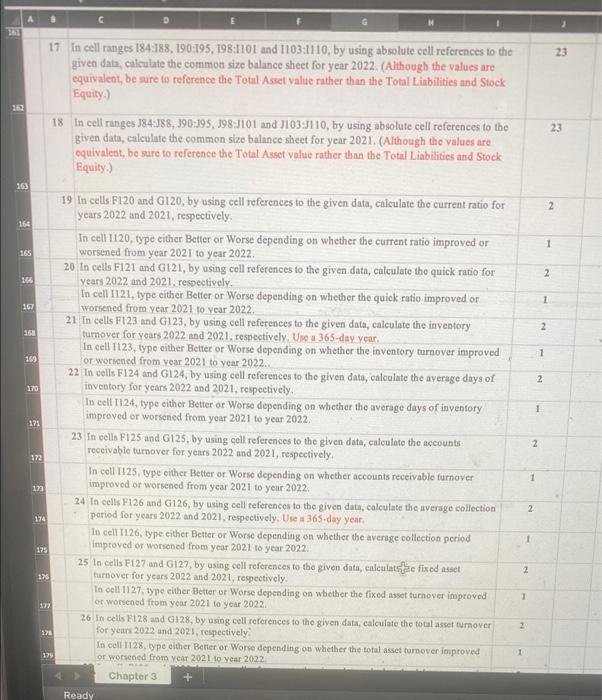
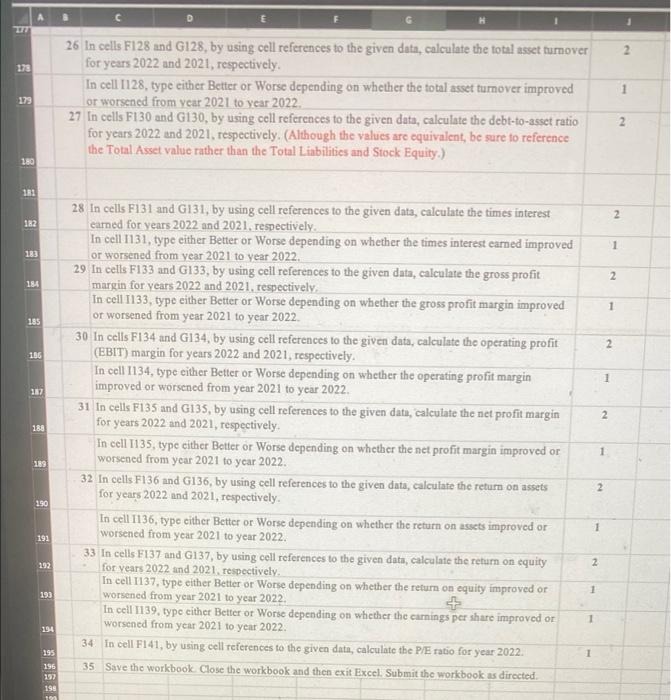
C Spreadsheet Exercise: Chapter 3 The income statement and balance sheet are the primary reports that a firm constructs for use by management and for distribution to stockholders, regulatory bodies, and the general public. They are the primary sources of historical financial information about the firm. Dayton Products, Inc., is a moderate-sized manufacturer. The company's manngement has asked you to perform a detailed financial statement analysis of the firm. The income statements for the years ending December 31, 2022 and 2021, respectively, are presented in the following table. Important: Do not use cell references to cells in rows 8 to 37. For all required answers, use cell references to values starting in row 58) 11 Annual Income Statements (Values in S Thousands) 2022 2021 Sales $ 178,909 S 187,510 Cost of goods sold 109,701 111.631 Selling general and administrative expenses 12,356 12.900 Other tax expense 33,572 33,377 Depreciation and amortization 12,103 7,944 Other income (add to EBIT to arrive at EBT) 3,147 3,323 Interest expense 398 293 Income tax rate 21% 21% Dividends paid per share 1.15 S 0.91 Basic EPS from total operations $ 1.64 S 2.87 12 13 15 $ 17 US OSA: ARRAXA 19 You also have the following balance sheet information as of December 31, 2022 and 2021, respectively. 21 23 26 27 Annual Balance Sheets (Values in S Thousands) 2022 2021 Carch $ 9,090 S 6,547 Receivables 21,163 19.549 Inventories 8,068 7.904 Other current assets 1,831 1.681 Property, plant and equipment, gross 204,960 187,519 Accumulated depreciation and depletion 110,020 97,917 Other noncurrent assets 19.413 17,891 Accounts payable 13,792 22,862 Short-term debt payable 4,093 3,703 Other current liabilities 15,290 3.549 Long-term debt payable 6.655 7,099 Deferred income taxes 16.484 16,359 Other noncurrent liabilities 21,733 16,441 Total Stockholders' Equity 76,458 73.161 Total common shares outstanding (million) 6.7 6.8 31 32 33 36 35 36 37 39 To Do 23 24 25 26 27 28 29 Annual Balance Sheets (Values in S Thousands) 2022 Cash S 9,090 S Receivables 21,163 Inventories 8,068 Other current assets 1,831 Property, plant and equipment, gross 204,960 Accumulated depreciation and depletion 110,020 Other noncurrent assets 19,413 Accounts payable 13,792 Short-term debt payable 4,093 Other current liabilities 15,290 Long-term debt payable 6,655 Deferred income taxes 16,484 Other noncurrent liabilities 21.733 Total Stockholders' Equity 76,458 Total common shares outstanding (million) 6.7 2021 6,547 19,549 7,904 1,681 187,519 97,917 17.891 22,862 3,703 3,549 7,099 16,359 16,441 73,161 6.8 30 31 32 33 34 35 36 37 36 39 40 41 42 To Do a. Create a spreadsheet similar to Table 3.1 to model the following: (1) A multiple-step comparative income statement for Dayton, Inc., for the periods ending December 31, 2022 and 2021. You must calculate the cost of goods sold for the year 2022. (2) A common size income statement for Dayton, Inc., covering the years 2022 and 2021. b. Create a spreadsheet similar to Tablc 3.2 to model the following: (1) A detailed, comparative balance sheet for Duyton, Inc., for the years ended December 31, 2022 and 2021. (2) A common size balance sheet for Dayton, Inc., covering the years 2022 and 2021. c. Create a spreadsheet similar to Table 3.5 to perform the following analysis: 43 44 45 45 47 (1) Create a table that reflects both 2022 and 2021 operating ratios for Dayton, Inc., segmented into (a) liquidity, (b) activity, (C) debt, (d) profitability, and (c) market. Assume that the current market price for the stock is $90. (2) Compare the 2022 ratios to the 2021 ratios. Indicate whether the results outperformed the prior year" or "underperformed relative to the prior year." 48 45 50 Solution 51 52 h. Create a spreadsheet similar to Table 3.1 to model the following: (1) A multiple-step comparative income statement for Dayton, Inc., for the periods ending December 31, 2022 and 2021. You must calculate the cost of goods sold for the year 2022 53 54 SS (2) A common size income statement for Dayton, Inc., covering the years 2022 and 2021. 56 Annual Income Statement (Values in S Thousands) 57 2022 5 178909 Sales Common Size 2022 2021 2021 19110 Solution 13 35 57 LO 1. Create a spreadsheet similar to Table 3.1 to model the following (1) A multiple-step comparative income statement for Dayton, Inc., for the periods ending December 31, 2022 and 2021. You must calculate the cost of goods sold for the year 2022. (2) A common size income statement for Dayton, Inc., covering the years 2022 and 2021. Annual Income Statement (Values in S Thousands) Common Size 2022 2021 2022 2021 Sales $ 178,909 S 187,510 Cost of goods sold 109,701 111,631 Gross operating profit S 69,2085 75,879 Selling general and administrative expenses 12.356 12.900 Other taxes 33,572 33,377 EBITDA S 81.704584,116 Depreciation and amortization 12,103 7.944 EBIT S 77325 18,042 Other income 3,147 3,323 Earnings before interest and taxes S 48.1255 53.794 Interest expense 398 293 Earnings before taxes 5. 150.905 5 163,050 Income taxes 21% Net Income available to common shareholders , EPS Dividends per share 1.64S 1.15ls S 2.87 0.91 h. Create a spreadsheet similar to Table 3.2 to model the following: (0) A detailed, comparative balance sheet for Dayton, Inc., for the years ended December 31, 2022 and 2021 (2) A common size balance sheet for Dayton, Inc., covering the years 2022 und 2021 ESE Anneal Balance Sheet (Values in Thousandi) Awes 2022 Common Sure 2022 2021 2021 BA 5 Current C Receivables Inventories Other cunt ut Total com Noncurs Troperty, plant and content Accumulate depreciation and depletion Pantani 9.0905 21.163 8,068 1.891 6547 19.549 7994 1681 Important. Although the values are equivalent De to reference the Total value rather than the Total Libes and Stock Equity 5.706,9605 187,519 110,020 92917 1 c . Create a spreadsheet similar to Table 3.2 to model the following: K 0 F (1) A detailed, comparative balance sheet for Dayton, Inc., for the years ended December 31, 2022 and 2021 (2) A common size balance sheet for Dayton, Inc., covering the years 2022 and 2021 Annual Balance Sheet (Values in S Thousands) 2022 2021 Common Size 2022 2021 S 9,090 21.163 8,068 1,831 6,547 19.549 7.904 Important: Although the values are equivalent, be sure to reference the Total Amet value rather than the Toul Liabilities and Stock Equity $ 204,960S 187519 110,020 97,917 19,413 12,891 Current Cath Receivables Investories Other current Total current Noncurrent Assets Property, plant and equipment, gross Accumulated depreciation and depletion Property, plant and equipment, net Other soncurrents Total boncurrent Total Assets abilities and Stock Equity Current liabilities Accounts payable Short-term debt payable Other current abilities Total curribilities Noncurrent les Long-term debt payable Deferred.com Other reliabilities Total Documentaties Total 5 VIN 101 560 103 1.3.1925 27,862 4,093 3.703 13,200 2,549 5 14484 21,200 7,099 16.159 To Schelde Total Labs Stock Illy 5 754585 22.101 18 Total com hodego) 67 6.8 114 la premtobe 15 to perform the following (1) 2022 2021 for Demo (6) civil de protect the price for the 590 (2) Compute2013 2011 Q c. Create a upreadsheet similar to Tohle 3.5 to perform the following analysis, Chate while that reflects both 2022 and 2021 operating rution for Dayton, Inc. emented into (1) liquidity, (b) activity (c) debt. (d) profitability, and (e) market. Assume that the current market price for the stock ls 590 (2) Compare the 2022 ta the 2021 ration. Indicate whether the results outperformed the prior you or underperformed relative to the prior your." 2022 2021 Analysis Important U165 day you Important day your Liquidity Ratios Current Quld be Activity Nation Inventory turnover Avere days of inventory Nccounts rivablarve Avere collection par Fedover Toalettmover Debt Ratios Debt-to- Tums interest Profitability Rates Oro promarin Operating profit margin Neprem Return to Important toute van valent beurt ere the Total Aerval the Total Liabilities and Stock ily Mart This per Pricht M. 1.64 90 MA 5 NA NA 141 Rq Polis 1 14 1 In Gondorces to be called the orig Profoten 2022 2021, 1 I del free to the end, the BITDA 2012 and 2021 tools 065 . W well as to the one who care for years 3023 2011.pdy 477, then it was 02 Indian ya 103 and 303 . 18 Points 2 2 2 2 2 2 140 2 150 6 2 2 151 14 152 Rquirements 1 In cells G60 and H60, by using cell references to the given data, calculate the gross operating profit for years 2022 and 2021, respectively. in cells G63 and H63, by using cell references to the given data, calculate the EBITDA for years 2022 and 2021, respectively. 3 In cells G65 and H65, by using cell references to the given data, calculate the EBIT for years 2022 and 2021, respectively 4. In cells G67 and H67, by using cell references to the given data, calculate the earnings before interest and taxes for years 2022 and 2021, respectively 5 In cells G69 and 169, by using cell references to the given data, calculate the earnings before taxes for years 2022 and 2021, respectively. In cells G70 and H70, by using cell references to the given data, calculate the income tax for years 2022 and 2021, respectively. In cells G71 and H71, by using cell references to the given data, calculate the net income available to common shareholders for years 2022 and 2021, respectively. 7 In cell range 158:171, by using cell references to the given data, calculate the common size income statement for year 2022. Begin in cell 158 with an absolute reference to cell G58 and copy/paste down the column In cell range J58:71, by using cell references to the given data, calculate the common size income statement for year 2021. Begin in cell 358 with an absolute reference to cell H58 and copy paste down the column In cells G88 and H88, by using cell references to the given data, calculate the total current assets for years 2022 and 2021, respectively. 10 In cells G92 and H92, by using cell references to the given data, calculate the property, plant and equipment, net for years 2022 and 2021, respectively 11 In cells G94 and 194, by using cell references to the given data, calculate the total noncurrent assets for years 2022 and 2021, respectively 12 In cells G95 und 195, by using cell references to the given data, calculate the total assets for years 2022 and 2021, respectively 13. In cells G101 and H101, by using cell references to the given data, calculate the total current liabilities for years 2022 and 2021, respectively 14 In cells G106 and H106, by using cell references to the given data, calculate the total noncurrent liabilities for years 2022 and 2021, respectively 15 In cells G107 and H107, by using cell references to the given data, calculate the total liabilities for years 2022 and 2021, respectively & 16 In cells G110 and H110, by using cell references to the given data, calculate the total liabilities and 2 stock equity for years 2022 and 2021, respectively 17 In cell ranges 184:188, 190:195, 198:1101 and 1103:1110, by using absolute cell references to the given data, calculate the common size balance sheet for year 2022. (Although the values are equivalent, be sure to reference the Total Asset value rather than the Total Liabilities and Stock 8 14 153 9 2 154 2 155 2 155 2 157 2 158 2 159 2 160 163 23 23 17 In cell ranges 184:188, 190:195, 198:1101 and 1103:1110, by using absolute cell references to the given data, calculate the common size balance sheet for year 2022. (Although the values are equivalent, be sure to reference the Total Asset value rather than the Total Liabilities and Stock Equity) 18 In cell ranges 184:188, 190:195, 198:101 und J103:110, by using absolute cell references to the given data, calculate the common size balance sheet for year 2021. (Although the values are equivalent, be sure to reference the Total Asset value rather than the Total Liabilities and Stock Equity) 23 163 2 166 1 165 2 166 1 10 2 101 1 169 2 2 170 1 171 19 In cells F120 and G120, by using cell references to the given data, calculate the current ratio for years 2022 and 2021, respectively, In cell 1120, type either Better or Worse depending on whether the current ratio improved or worsened from year 2021 to year 2022. 20 in cells F121 and G121, by using cell references to the given data, calculate the quick ratio for years 2022 and 2021. respectively, In cell 1121, type either Better or Worse depending on whether the quick ratio improved or worsened from year 2021 to year 2022 21 In cells F123 and G123, by using cell references to the given data, calculate the inventory turnover for years 2022 and 2021. respectively. Use a 365-day year. In cell 1123, type either Better or Worse depending on whether the inventory turnover improved or worsened from year 2021 to year 2022 22 In cells F124 and G124, by using cell references to the given data, calculate the average days of inventory for years 2022 and 2021, respectively, In cell 1124, type either Better or Worse depending on whether the average days of inventory improved or worsened from year 2021 to year 2022 23 in cells F125 and G125, by using cell references to the given data, calculate the accounts: receivable turnover for years 2022 and 2021, respectively In cell 1125, type either Better or Worse depending on whether accounts receivable turnover improved or worsened from year 2021 to year 2022 24 In cells F126 und G126, by using cell references to the given data, calculate the average collection period for yearu 2022 and 2021, respectively. Use : 365-day year In cell 1126, type either Better or Worse depending on whether the average collection period improved or worsened from year 2021 to year 2022 25 in cells F127 and G127. by using cell references to the given data, calculate fixed asset turnover for years 2022 and 2021, respectively In cell 1127, type either Better or Worse depending on whether the fixed asset turnover improved or worsened from your 2021 to year 2022 26 In cells F128 and G128, by using cell references to the given data, calculate the total asset turnover for years 2022 and 2021, respectively In cell 1128, type either Better or Worse depending on whether the total asset turnover improved or worsened from year 2021 to year 2022 Chapter 3 2 172 1 17 2 174 1 175 2 17 1 172 1 27 129 1 Ready E 27 2 123 179 26 In cells F128 and G128, by using cell references to the given data, calculate the total asset tumover for years 2022 und 2021, respectively. In cell 1128, type either Better or Worse depending on whether the total asset turnover improved or worsened from year 2021 to year 2022 27 In cells F130 and G130, by using cell references to the given data, calculate the debt-to-asset ratio for years 2022 and 2021, respectively. (Although the values are equivalent, be sure to reference the Total Asset value rather than the Total Liabilities and Stock Equity) 2 180 181 2 182 1 183 2 184 1 185 2 166 1 2 188 28 In cells F131 and G131, by using cell references to the given data, calculate the times interest earned for years 2022 and 2021, respectively In cell 1131, type either Better or Worse depending on whether the times interest earned improved or worsened from year 2021 to year 2022 29 In cells F133 and G133, by using cell references to the given data, calculate the gross profit margin for years 2022 and 2021, respectively, In cell 1133, type either Better or Worse depending on whether the gross profit margin improved or worsened from year 2021 to year 2022. 30 In cells F134 and G134, by using cell references to the given data, calculate the operating profit (EBIT) margin for years 2022 and 2021, respectively. In cell 1134, type either Better or Worse depending on whether the operating profit margin improved or worsened from year 2021 to year 2022 31 in cells F135 and G135, by using cell references to the given data, calculate the net profit margin for years 2022 and 2021, respectively In cell 1135, type either Botter or Worse depending on whether the net profit margin improved or worsened from year 2021 to year 2022. 32 In cells F136 and G136, by using cell references to the given data, calculate the return on assets for years 2022 and 2021, respectively In cell 1136, type either Better or Worse depending on whether the return on assets improved or worsened from year 2021 to year 2022. 33 In cells F137 and G137, by using cell references to the given data, calculate the return on equity for years 2022 and 2021, respectively. In cell 1137, type either Better or Worse depending on whether the return on equity improved or worsened from year 2021 to year 2022. In cell 1139, type either Better or Worse depending on whether the carnings per share improved or worsened from year 2021 to year 2022 34 In cell F141, by using cell references to the given data, calculate the P/E ratio for year 2022 35 Save the workbook Close the workbook and then exit Excel. Submit the workbook as directed 1 19 2 150 1 191 192 2 1 193 1 194 195 1 196 198 C Spreadsheet Exercise: Chapter 3 The income statement and balance sheet are the primary reports that a firm constructs for use by management and for distribution to stockholders, regulatory bodies, and the general public. They are the primary sources of historical financial information about the firm. Dayton Products, Inc., is a moderate-sized manufacturer. The company's manngement has asked you to perform a detailed financial statement analysis of the firm. The income statements for the years ending December 31, 2022 and 2021, respectively, are presented in the following table. Important: Do not use cell references to cells in rows 8 to 37. For all required answers, use cell references to values starting in row 58) 11 Annual Income Statements (Values in S Thousands) 2022 2021 Sales $ 178,909 S 187,510 Cost of goods sold 109,701 111.631 Selling general and administrative expenses 12,356 12.900 Other tax expense 33,572 33,377 Depreciation and amortization 12,103 7,944 Other income (add to EBIT to arrive at EBT) 3,147 3,323 Interest expense 398 293 Income tax rate 21% 21% Dividends paid per share 1.15 S 0.91 Basic EPS from total operations $ 1.64 S 2.87 12 13 15 $ 17 US OSA: ARRAXA 19 You also have the following balance sheet information as of December 31, 2022 and 2021, respectively. 21 23 26 27 Annual Balance Sheets (Values in S Thousands) 2022 2021 Carch $ 9,090 S 6,547 Receivables 21,163 19.549 Inventories 8,068 7.904 Other current assets 1,831 1.681 Property, plant and equipment, gross 204,960 187,519 Accumulated depreciation and depletion 110,020 97,917 Other noncurrent assets 19.413 17,891 Accounts payable 13,792 22,862 Short-term debt payable 4,093 3,703 Other current liabilities 15,290 3.549 Long-term debt payable 6.655 7,099 Deferred income taxes 16.484 16,359 Other noncurrent liabilities 21,733 16,441 Total Stockholders' Equity 76,458 73.161 Total common shares outstanding (million) 6.7 6.8 31 32 33 36 35 36 37 39 To Do 23 24 25 26 27 28 29 Annual Balance Sheets (Values in S Thousands) 2022 Cash S 9,090 S Receivables 21,163 Inventories 8,068 Other current assets 1,831 Property, plant and equipment, gross 204,960 Accumulated depreciation and depletion 110,020 Other noncurrent assets 19,413 Accounts payable 13,792 Short-term debt payable 4,093 Other current liabilities 15,290 Long-term debt payable 6,655 Deferred income taxes 16,484 Other noncurrent liabilities 21.733 Total Stockholders' Equity 76,458 Total common shares outstanding (million) 6.7 2021 6,547 19,549 7,904 1,681 187,519 97,917 17.891 22,862 3,703 3,549 7,099 16,359 16,441 73,161 6.8 30 31 32 33 34 35 36 37 36 39 40 41 42 To Do a. Create a spreadsheet similar to Table 3.1 to model the following: (1) A multiple-step comparative income statement for Dayton, Inc., for the periods ending December 31, 2022 and 2021. You must calculate the cost of goods sold for the year 2022. (2) A common size income statement for Dayton, Inc., covering the years 2022 and 2021. b. Create a spreadsheet similar to Tablc 3.2 to model the following: (1) A detailed, comparative balance sheet for Duyton, Inc., for the years ended December 31, 2022 and 2021. (2) A common size balance sheet for Dayton, Inc., covering the years 2022 and 2021. c. Create a spreadsheet similar to Table 3.5 to perform the following analysis: 43 44 45 45 47 (1) Create a table that reflects both 2022 and 2021 operating ratios for Dayton, Inc., segmented into (a) liquidity, (b) activity, (C) debt, (d) profitability, and (c) market. Assume that the current market price for the stock is $90. (2) Compare the 2022 ratios to the 2021 ratios. Indicate whether the results outperformed the prior year" or "underperformed relative to the prior year." 48 45 50 Solution 51 52 h. Create a spreadsheet similar to Table 3.1 to model the following: (1) A multiple-step comparative income statement for Dayton, Inc., for the periods ending December 31, 2022 and 2021. You must calculate the cost of goods sold for the year 2022 53 54 SS (2) A common size income statement for Dayton, Inc., covering the years 2022 and 2021. 56 Annual Income Statement (Values in S Thousands) 57 2022 5 178909 Sales Common Size 2022 2021 2021 19110 Solution 13 35 57 LO 1. Create a spreadsheet similar to Table 3.1 to model the following (1) A multiple-step comparative income statement for Dayton, Inc., for the periods ending December 31, 2022 and 2021. You must calculate the cost of goods sold for the year 2022. (2) A common size income statement for Dayton, Inc., covering the years 2022 and 2021. Annual Income Statement (Values in S Thousands) Common Size 2022 2021 2022 2021 Sales $ 178,909 S 187,510 Cost of goods sold 109,701 111,631 Gross operating profit S 69,2085 75,879 Selling general and administrative expenses 12.356 12.900 Other taxes 33,572 33,377 EBITDA S 81.704584,116 Depreciation and amortization 12,103 7.944 EBIT S 77325 18,042 Other income 3,147 3,323 Earnings before interest and taxes S 48.1255 53.794 Interest expense 398 293 Earnings before taxes 5. 150.905 5 163,050 Income taxes 21% Net Income available to common shareholders , EPS Dividends per share 1.64S 1.15ls S 2.87 0.91 h. Create a spreadsheet similar to Table 3.2 to model the following: (0) A detailed, comparative balance sheet for Dayton, Inc., for the years ended December 31, 2022 and 2021 (2) A common size balance sheet for Dayton, Inc., covering the years 2022 und 2021 ESE Anneal Balance Sheet (Values in Thousandi) Awes 2022 Common Sure 2022 2021 2021 BA 5 Current C Receivables Inventories Other cunt ut Total com Noncurs Troperty, plant and content Accumulate depreciation and depletion Pantani 9.0905 21.163 8,068 1.891 6547 19.549 7994 1681 Important. Although the values are equivalent De to reference the Total value rather than the Total Libes and Stock Equity 5.706,9605 187,519 110,020 92917 1 c . Create a spreadsheet similar to Table 3.2 to model the following: K 0 F (1) A detailed, comparative balance sheet for Dayton, Inc., for the years ended December 31, 2022 and 2021 (2) A common size balance sheet for Dayton, Inc., covering the years 2022 and 2021 Annual Balance Sheet (Values in S Thousands) 2022 2021 Common Size 2022 2021 S 9,090 21.163 8,068 1,831 6,547 19.549 7.904 Important: Although the values are equivalent, be sure to reference the Total Amet value rather than the Toul Liabilities and Stock Equity $ 204,960S 187519 110,020 97,917 19,413 12,891 Current Cath Receivables Investories Other current Total current Noncurrent Assets Property, plant and equipment, gross Accumulated depreciation and depletion Property, plant and equipment, net Other soncurrents Total boncurrent Total Assets abilities and Stock Equity Current liabilities Accounts payable Short-term debt payable Other current abilities Total curribilities Noncurrent les Long-term debt payable Deferred.com Other reliabilities Total Documentaties Total 5 VIN 101 560 103 1.3.1925 27,862 4,093 3.703 13,200 2,549 5 14484 21,200 7,099 16.159 To Schelde Total Labs Stock Illy 5 754585 22.101 18 Total com hodego) 67 6.8 114 la premtobe 15 to perform the following (1) 2022 2021 for Demo (6) civil de protect the price for the 590 (2) Compute2013 2011 Q c. Create a upreadsheet similar to Tohle 3.5 to perform the following analysis, Chate while that reflects both 2022 and 2021 operating rution for Dayton, Inc. emented into (1) liquidity, (b) activity (c) debt. (d) profitability, and (e) market. Assume that the current market price for the stock ls 590 (2) Compare the 2022 ta the 2021 ration. Indicate whether the results outperformed the prior you or underperformed relative to the prior your." 2022 2021 Analysis Important U165 day you Important day your Liquidity Ratios Current Quld be Activity Nation Inventory turnover Avere days of inventory Nccounts rivablarve Avere collection par Fedover Toalettmover Debt Ratios Debt-to- Tums interest Profitability Rates Oro promarin Operating profit margin Neprem Return to Important toute van valent beurt ere the Total Aerval the Total Liabilities and Stock ily Mart This per Pricht M. 1.64 90 MA 5 NA NA 141 Rq Polis 1 14 1 In Gondorces to be called the orig Profoten 2022 2021, 1 I del free to the end, the BITDA 2012 and 2021 tools 065 . W well as to the one who care for years 3023 2011.pdy 477, then it was 02 Indian ya 103 and 303 . 18 Points 2 2 2 2 2 2 140 2 150 6 2 2 151 14 152 Rquirements 1 In cells G60 and H60, by using cell references to the given data, calculate the gross operating profit for years 2022 and 2021, respectively. in cells G63 and H63, by using cell references to the given data, calculate the EBITDA for years 2022 and 2021, respectively. 3 In cells G65 and H65, by using cell references to the given data, calculate the EBIT for years 2022 and 2021, respectively 4. In cells G67 and H67, by using cell references to the given data, calculate the earnings before interest and taxes for years 2022 and 2021, respectively 5 In cells G69 and 169, by using cell references to the given data, calculate the earnings before taxes for years 2022 and 2021, respectively. In cells G70 and H70, by using cell references to the given data, calculate the income tax for years 2022 and 2021, respectively. In cells G71 and H71, by using cell references to the given data, calculate the net income available to common shareholders for years 2022 and 2021, respectively. 7 In cell range 158:171, by using cell references to the given data, calculate the common size income statement for year 2022. Begin in cell 158 with an absolute reference to cell G58 and copy/paste down the column In cell range J58:71, by using cell references to the given data, calculate the common size income statement for year 2021. Begin in cell 358 with an absolute reference to cell H58 and copy paste down the column In cells G88 and H88, by using cell references to the given data, calculate the total current assets for years 2022 and 2021, respectively. 10 In cells G92 and H92, by using cell references to the given data, calculate the property, plant and equipment, net for years 2022 and 2021, respectively 11 In cells G94 and 194, by using cell references to the given data, calculate the total noncurrent assets for years 2022 and 2021, respectively 12 In cells G95 und 195, by using cell references to the given data, calculate the total assets for years 2022 and 2021, respectively 13. In cells G101 and H101, by using cell references to the given data, calculate the total current liabilities for years 2022 and 2021, respectively 14 In cells G106 and H106, by using cell references to the given data, calculate the total noncurrent liabilities for years 2022 and 2021, respectively 15 In cells G107 and H107, by using cell references to the given data, calculate the total liabilities for years 2022 and 2021, respectively & 16 In cells G110 and H110, by using cell references to the given data, calculate the total liabilities and 2 stock equity for years 2022 and 2021, respectively 17 In cell ranges 184:188, 190:195, 198:1101 and 1103:1110, by using absolute cell references to the given data, calculate the common size balance sheet for year 2022. (Although the values are equivalent, be sure to reference the Total Asset value rather than the Total Liabilities and Stock 8 14 153 9 2 154 2 155 2 155 2 157 2 158 2 159 2 160 163 23 23 17 In cell ranges 184:188, 190:195, 198:1101 and 1103:1110, by using absolute cell references to the given data, calculate the common size balance sheet for year 2022. (Although the values are equivalent, be sure to reference the Total Asset value rather than the Total Liabilities and Stock Equity) 18 In cell ranges 184:188, 190:195, 198:101 und J103:110, by using absolute cell references to the given data, calculate the common size balance sheet for year 2021. (Although the values are equivalent, be sure to reference the Total Asset value rather than the Total Liabilities and Stock Equity) 23 163 2 166 1 165 2 166 1 10 2 101 1 169 2 2 170 1 171 19 In cells F120 and G120, by using cell references to the given data, calculate the current ratio for years 2022 and 2021, respectively, In cell 1120, type either Better or Worse depending on whether the current ratio improved or worsened from year 2021 to year 2022. 20 in cells F121 and G121, by using cell references to the given data, calculate the quick ratio for years 2022 and 2021. respectively, In cell 1121, type either Better or Worse depending on whether the quick ratio improved or worsened from year 2021 to year 2022 21 In cells F123 and G123, by using cell references to the given data, calculate the inventory turnover for years 2022 and 2021. respectively. Use a 365-day year. In cell 1123, type either Better or Worse depending on whether the inventory turnover improved or worsened from year 2021 to year 2022 22 In cells F124 and G124, by using cell references to the given data, calculate the average days of inventory for years 2022 and 2021, respectively, In cell 1124, type either Better or Worse depending on whether the average days of inventory improved or worsened from year 2021 to year 2022 23 in cells F125 and G125, by using cell references to the given data, calculate the accounts: receivable turnover for years 2022 and 2021, respectively In cell 1125, type either Better or Worse depending on whether accounts receivable turnover improved or worsened from year 2021 to year 2022 24 In cells F126 und G126, by using cell references to the given data, calculate the average collection period for yearu 2022 and 2021, respectively. Use : 365-day year In cell 1126, type either Better or Worse depending on whether the average collection period improved or worsened from year 2021 to year 2022 25 in cells F127 and G127. by using cell references to the given data, calculate fixed asset turnover for years 2022 and 2021, respectively In cell 1127, type either Better or Worse depending on whether the fixed asset turnover improved or worsened from your 2021 to year 2022 26 In cells F128 and G128, by using cell references to the given data, calculate the total asset turnover for years 2022 and 2021, respectively In cell 1128, type either Better or Worse depending on whether the total asset turnover improved or worsened from year 2021 to year 2022 Chapter 3 2 172 1 17 2 174 1 175 2 17 1 172 1 27 129 1 Ready E 27 2 123 179 26 In cells F128 and G128, by using cell references to the given data, calculate the total asset tumover for years 2022 und 2021, respectively. In cell 1128, type either Better or Worse depending on whether the total asset turnover improved or worsened from year 2021 to year 2022 27 In cells F130 and G130, by using cell references to the given data, calculate the debt-to-asset ratio for years 2022 and 2021, respectively. (Although the values are equivalent, be sure to reference the Total Asset value rather than the Total Liabilities and Stock Equity) 2 180 181 2 182 1 183 2 184 1 185 2 166 1 2 188 28 In cells F131 and G131, by using cell references to the given data, calculate the times interest earned for years 2022 and 2021, respectively In cell 1131, type either Better or Worse depending on whether the times interest earned improved or worsened from year 2021 to year 2022 29 In cells F133 and G133, by using cell references to the given data, calculate the gross profit margin for years 2022 and 2021, respectively, In cell 1133, type either Better or Worse depending on whether the gross profit margin improved or worsened from year 2021 to year 2022. 30 In cells F134 and G134, by using cell references to the given data, calculate the operating profit (EBIT) margin for years 2022 and 2021, respectively. In cell 1134, type either Better or Worse depending on whether the operating profit margin improved or worsened from year 2021 to year 2022 31 in cells F135 and G135, by using cell references to the given data, calculate the net profit margin for years 2022 and 2021, respectively In cell 1135, type either Botter or Worse depending on whether the net profit margin improved or worsened from year 2021 to year 2022. 32 In cells F136 and G136, by using cell references to the given data, calculate the return on assets for years 2022 and 2021, respectively In cell 1136, type either Better or Worse depending on whether the return on assets improved or worsened from year 2021 to year 2022. 33 In cells F137 and G137, by using cell references to the given data, calculate the return on equity for years 2022 and 2021, respectively. In cell 1137, type either Better or Worse depending on whether the return on equity improved or worsened from year 2021 to year 2022. In cell 1139, type either Better or Worse depending on whether the carnings per share improved or worsened from year 2021 to year 2022 34 In cell F141, by using cell references to the given data, calculate the P/E ratio for year 2022 35 Save the workbook Close the workbook and then exit Excel. Submit the workbook as directed 1 19 2 150 1 191 192 2 1 193 1 194 195 1 196 198 Step by Step Solution
There are 3 Steps involved in it
Step: 1

Get Instant Access to Expert-Tailored Solutions
See step-by-step solutions with expert insights and AI powered tools for academic success
Step: 2

Step: 3
Ace Your Homework with AI
Get the answers you need in no time with our AI-driven, step-by-step assistance
Get Started
Fundamentals of Financial Management
Authors: Eugene F. Brigham, Joel F. Houston
Concise 6th Edition
324664559, 978-0324664553