Please help code the following in python. Thank you.

Link To the Iris Flower DataSet: https://en.wikipedia.org/wiki/Iris_flower_data_set
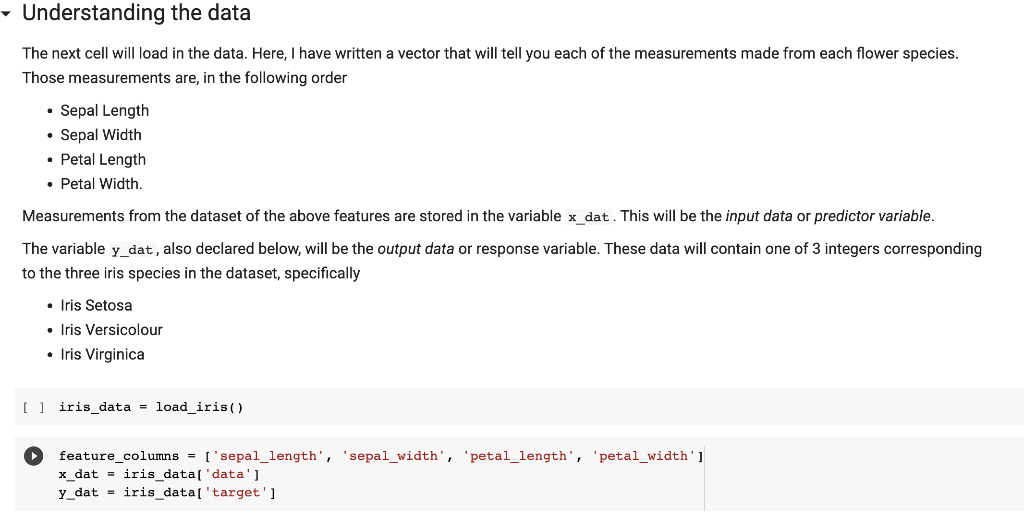
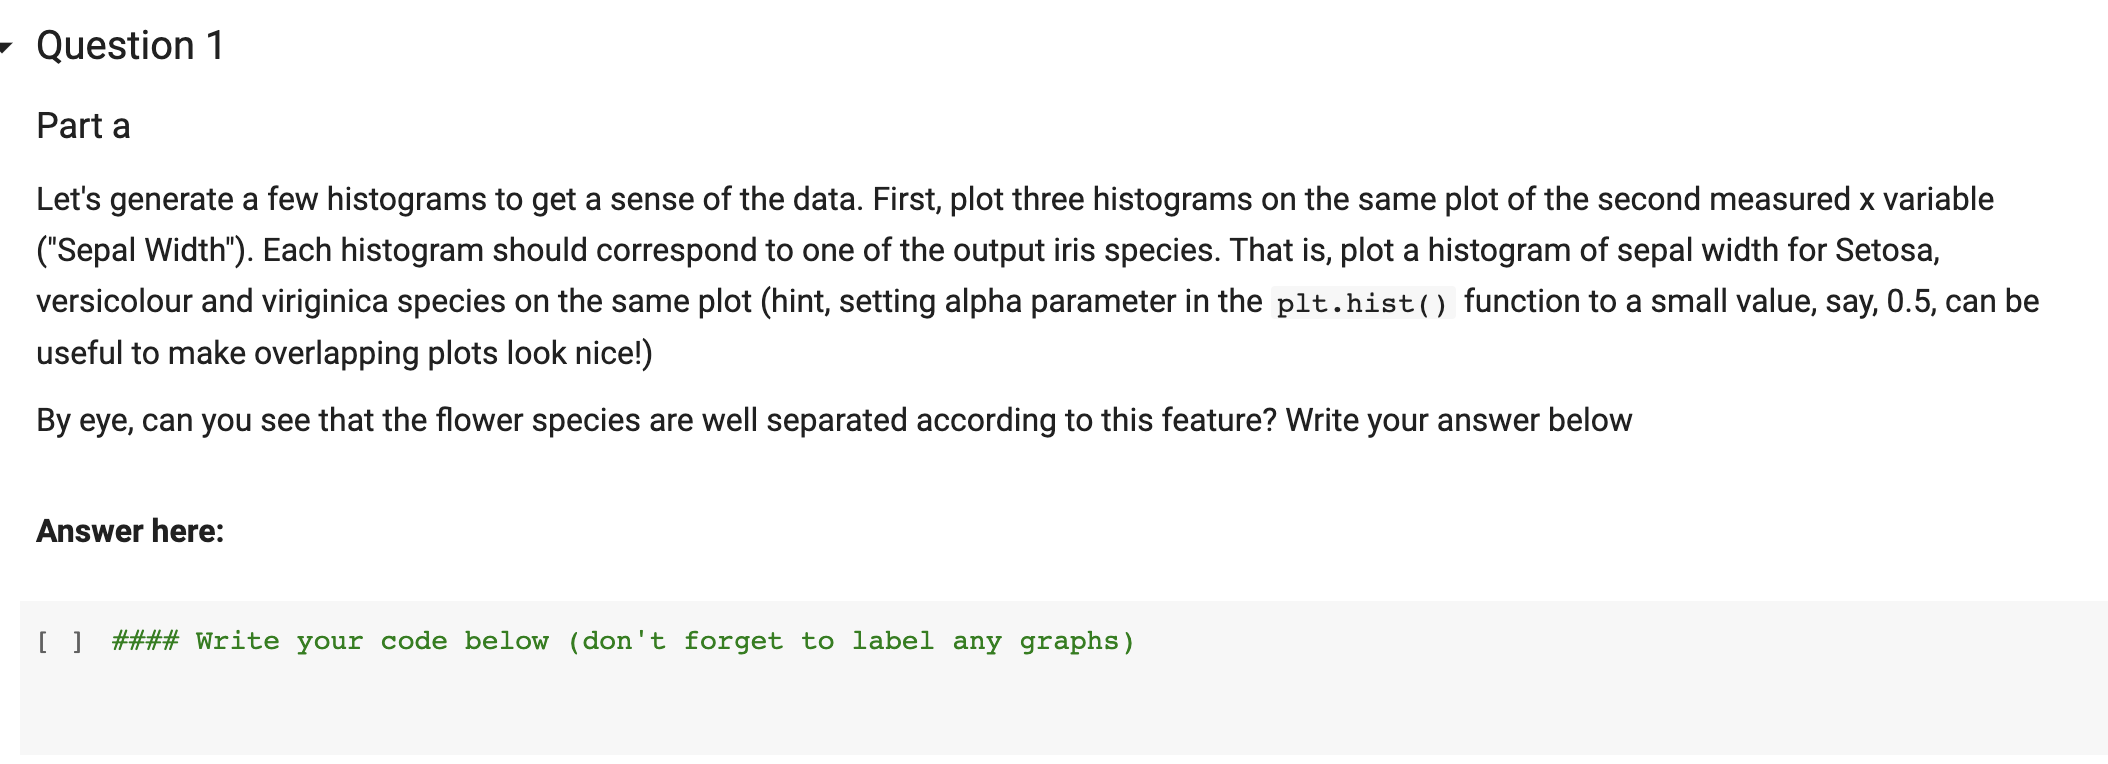
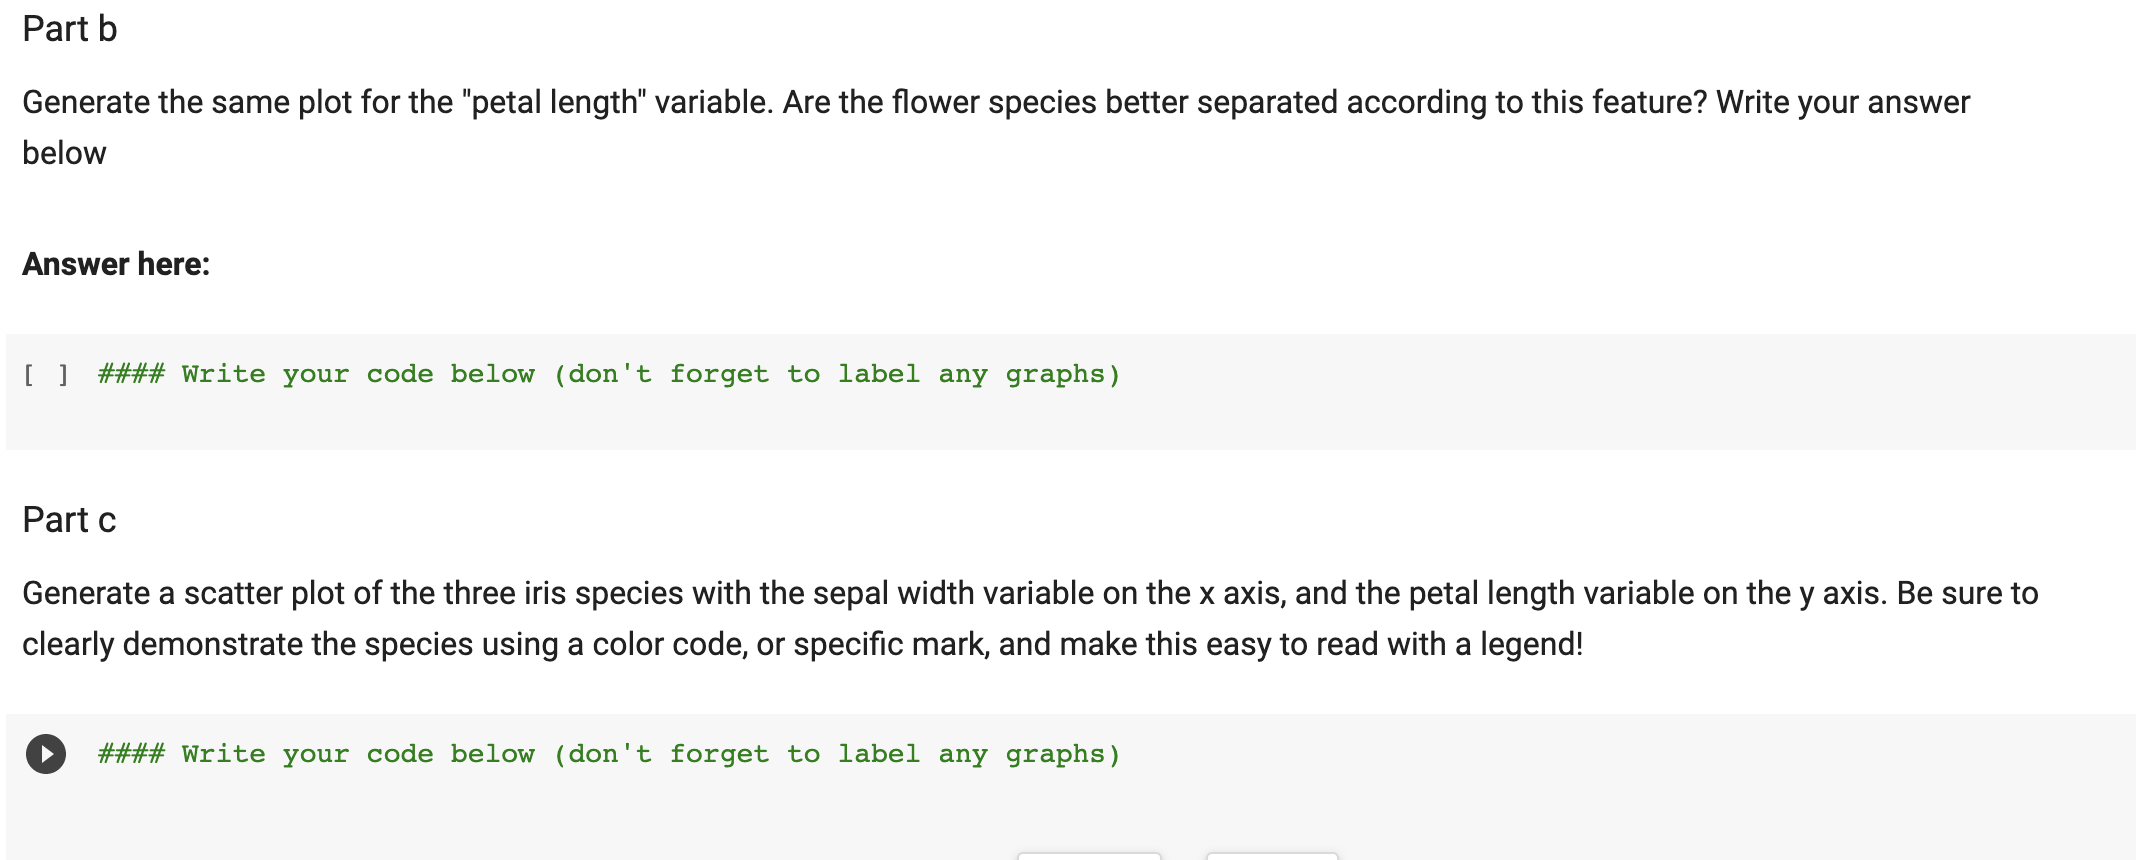
Understanding the problem For this problem set we will be working with on with a popular data set used in biological modeling called the This dataset is typically used for classification, when we use different measurements from distinct flower species and try to correctly categorize them from their measurements. A variety of machine learning methods may be used on this dataset, but for this problem set we will focus on multivariate linear regression. Though linear regression is not explicitly designed for predicting species (classification) the linear regression framework is flexible enough to do it. Let us first import some package so we can easily work with the data. Fortunately, the data can be downloaded directly into our notebooks from the scikitlearn python package. [ ] \# Importing dataset from scikit-learn and other useful packages: from sklearn.model_selection import train_test_split from sklearn.datasets import load_iris import matplotlib.pyplot as plt import numpy as np \# we will fix a random seed for reproducibility: seed = 11 np.random.seed(seed) The next cell will load in the data. Here, I have written a vector that will tell you each of the measurements made from each flower species. Those measurements are, in the following order - Sepal Length - Sepal Width - Petal Length - Petal Width. Measurements from the dataset of the above features are stored in the variable xdat. This will be the input data or predictor variable. The variable y_dat, also declared below, will be the output data or response variable. These data will contain one of 3 integers corresponding to the three iris species in the dataset, specifically - Iris Setosa - Iris Versicolour - Iris Virginica [ ] iris_data = load_iris () feature_columns =[ 'sepal_length', 'sepal_width', 'petal_length', 'petal_width' ] x_dat = iris_data[ 'data'] y_dat = iris_data[ 'target'] Part a Let's generate a few histograms to get a sense of the data. First, plot three histograms on the same plot of the second measured x variable ("Sepal Width"). Each histogram should correspond to one of the output iris species. That is, plot a histogram of sepal width for Setosa, versicolour and viriginica species on the same plot (hint, setting alpha parameter in the plt.hist () function to a small value, say, 0.5, can be useful to make overlapping plots look nice!) By eye, can you see that the flower species are well separated according to this feature? Write your answer below Answer here: Part b Generate the same plot for the "petal length" variable. Are the flower species better separated according to this feature? Write your answer below Answer here: [ ] \#\#\#\# Write your code below (don't forget to label any graphs) Part c Generate a scatter plot of the three iris species with the sepal width variable on the x axis, and the petal length variable on the y axis. Be sure to clearly demonstrate the species using a color code, or specific mark, and make this easy to read with a legend! \#\#\#\# Write your code below (don't forget to label any graphs) Understanding the problem For this problem set we will be working with on with a popular data set used in biological modeling called the This dataset is typically used for classification, when we use different measurements from distinct flower species and try to correctly categorize them from their measurements. A variety of machine learning methods may be used on this dataset, but for this problem set we will focus on multivariate linear regression. Though linear regression is not explicitly designed for predicting species (classification) the linear regression framework is flexible enough to do it. Let us first import some package so we can easily work with the data. Fortunately, the data can be downloaded directly into our notebooks from the scikitlearn python package. [ ] \# Importing dataset from scikit-learn and other useful packages: from sklearn.model_selection import train_test_split from sklearn.datasets import load_iris import matplotlib.pyplot as plt import numpy as np \# we will fix a random seed for reproducibility: seed = 11 np.random.seed(seed) The next cell will load in the data. Here, I have written a vector that will tell you each of the measurements made from each flower species. Those measurements are, in the following order - Sepal Length - Sepal Width - Petal Length - Petal Width. Measurements from the dataset of the above features are stored in the variable xdat. This will be the input data or predictor variable. The variable y_dat, also declared below, will be the output data or response variable. These data will contain one of 3 integers corresponding to the three iris species in the dataset, specifically - Iris Setosa - Iris Versicolour - Iris Virginica [ ] iris_data = load_iris () feature_columns =[ 'sepal_length', 'sepal_width', 'petal_length', 'petal_width' ] x_dat = iris_data[ 'data'] y_dat = iris_data[ 'target'] Part a Let's generate a few histograms to get a sense of the data. First, plot three histograms on the same plot of the second measured x variable ("Sepal Width"). Each histogram should correspond to one of the output iris species. That is, plot a histogram of sepal width for Setosa, versicolour and viriginica species on the same plot (hint, setting alpha parameter in the plt.hist () function to a small value, say, 0.5, can be useful to make overlapping plots look nice!) By eye, can you see that the flower species are well separated according to this feature? Write your answer below Answer here: Part b Generate the same plot for the "petal length" variable. Are the flower species better separated according to this feature? Write your answer below Answer here: [ ] \#\#\#\# Write your code below (don't forget to label any graphs) Part c Generate a scatter plot of the three iris species with the sepal width variable on the x axis, and the petal length variable on the y axis. Be sure to clearly demonstrate the species using a color code, or specific mark, and make this easy to read with a legend! \#\#\#\# Write your code below (don't forget to label any graphs)