please help complete this for me

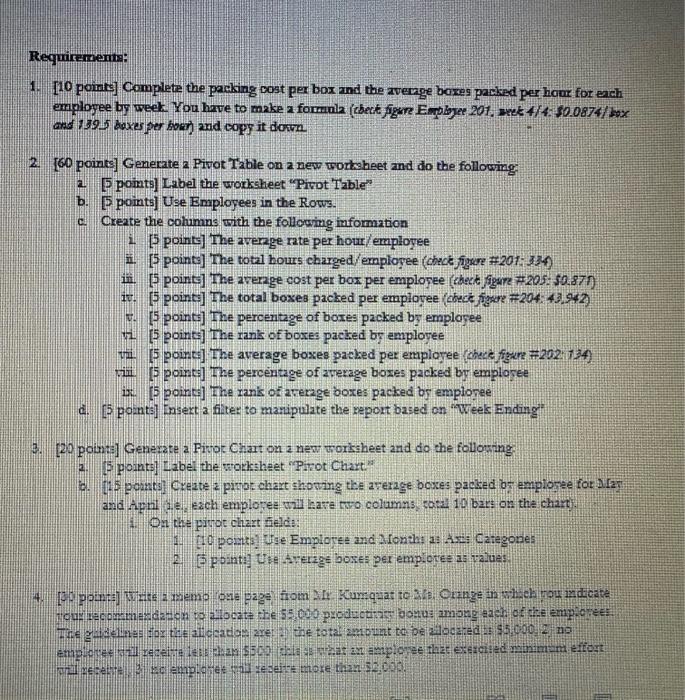
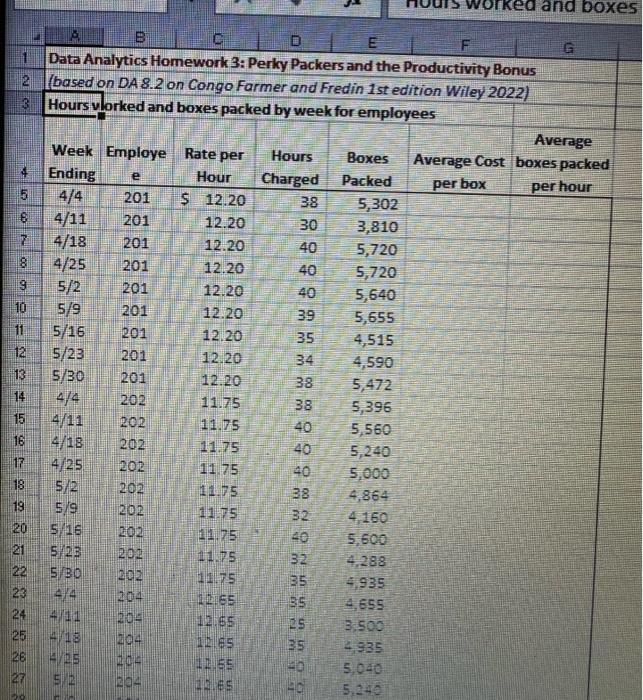
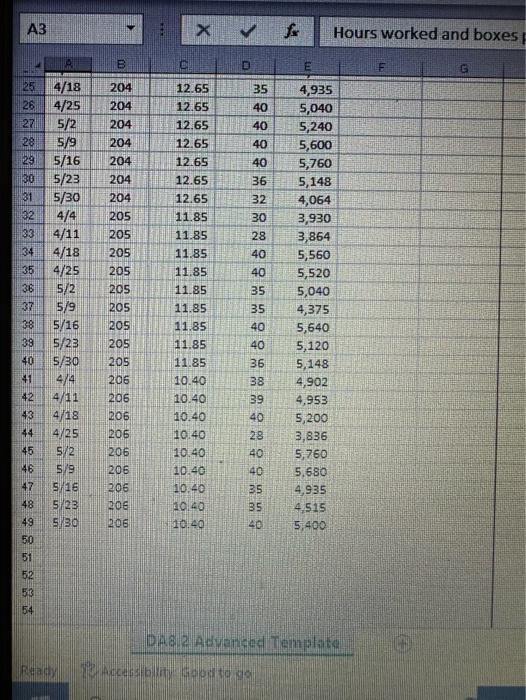
Datz Analytics Homework 3: Perky Packers and the Productivity Bonus The purpose of this homework is to get you to work on Excel Formulas, Pirot Tables, and Pivot Charts, which are very useful in summarizing datz and presenting them in charts and visualizations. The Problem is based on Problem DA 8.2 on the Congo-Farmer \&. Fredin Text book, which is only available if I assign the problem in an online. However, I want you to tum in pour Excel work and, therefore, I am making the exercise a formal D2tz Analytics Homework. After reading the problem, the requirements ask you to work on some fomblas in excel (Task 1), create a Pinot Table (Task 2), create a Pirot Chart (Task 3), create a memo to report your conclusion (Task 4). Delirerables: 1. An Excel Fie vith the data and the pirot table and pirot chart 2. A Jas Word file thith the memo to the plant manager. Problem Persy Raekers is 2 medium-iizes shipping company chat contracts it paciang sertices so Wn-San, an organc runucrees company in wheh its products aze warehoused it a tubutb of Orange, Flosida. Requirements: 1. [10 points] Complete the paoking cost per box and the avenge boxes packed per hour for erah and 1395 boxesper bobj and copy it down 2. [60 points] Generate a Pivot T2ble on a new wotkshet and do the following: 2. [5 points] Label the worksheet "Pirot Table" b. [5 points] Use Employees in the Rows. c. Create the columns with the following information i. [5 points] The average rate per hour / employee ii. [5 points] The total bours charged/emplovee (check figare \#201:334) iii. [5 pointe] The average cost per box per emplopee (check figare #205:50.877 ) iv. [5 point] The total boses packed per employee (cbece frgare 7204,43.942 ) 7. [5 point] The percentage of boxes packed by employee 7i. 15 points] The rank of boxes packed by employee 7i. [5 poinci] The average boses paeked per employee (chccef fisare #202.134 \} Tiii. [5 poince] The percntage of awezage boxes packed by emploree ix. [5 point] The rank of arerage boxes packed by emploree c. [5 points] [nsert a filter to maripulate the report based on "Wees Ending" 3. [20 point] Genezate a Firror Ciat on a new worksheet and do the folloning: 2. [5 points] Label the mouksheet "Prot Chart" 6. [1S points] Create a pirot chart chowing the average boxes packed br emplogee for Mar and Apni 1.e, ezch emplores will have tro columns, sout 10 bars on the chat, 1. Oa the pinot chart fields: 1. If pomt! Uise Emploree and Montht at Axt: Categones 2. [Spointi] Uis Arerzege bores per empioree as raluas: wis worked and boxes A3 > f Hours worked and boxes Dinaza Advancod Tienquato Datz Analytics Homework 3: Perky Packers and the Productivity Bonus The purpose of this homework is to get you to work on Excel Formulas, Pirot Tables, and Pivot Charts, which are very useful in summarizing datz and presenting them in charts and visualizations. The Problem is based on Problem DA 8.2 on the Congo-Farmer \&. Fredin Text book, which is only available if I assign the problem in an online. However, I want you to tum in pour Excel work and, therefore, I am making the exercise a formal D2tz Analytics Homework. After reading the problem, the requirements ask you to work on some fomblas in excel (Task 1), create a Pinot Table (Task 2), create a Pirot Chart (Task 3), create a memo to report your conclusion (Task 4). Delirerables: 1. An Excel Fie vith the data and the pirot table and pirot chart 2. A Jas Word file thith the memo to the plant manager. Problem Persy Raekers is 2 medium-iizes shipping company chat contracts it paciang sertices so Wn-San, an organc runucrees company in wheh its products aze warehoused it a tubutb of Orange, Flosida. Requirements: 1. [10 points] Complete the paoking cost per box and the avenge boxes packed per hour for erah and 1395 boxesper bobj and copy it down 2. [60 points] Generate a Pivot T2ble on a new wotkshet and do the following: 2. [5 points] Label the worksheet "Pirot Table" b. [5 points] Use Employees in the Rows. c. Create the columns with the following information i. [5 points] The average rate per hour / employee ii. [5 points] The total bours charged/emplovee (check figare \#201:334) iii. [5 pointe] The average cost per box per emplopee (check figare #205:50.877 ) iv. [5 point] The total boses packed per employee (cbece frgare 7204,43.942 ) 7. [5 point] The percentage of boxes packed by employee 7i. 15 points] The rank of boxes packed by employee 7i. [5 poinci] The average boses paeked per employee (chccef fisare #202.134 \} Tiii. [5 poince] The percntage of awezage boxes packed by emploree ix. [5 point] The rank of arerage boxes packed by emploree c. [5 points] [nsert a filter to maripulate the report based on "Wees Ending" 3. [20 point] Genezate a Firror Ciat on a new worksheet and do the folloning: 2. [5 points] Label the mouksheet "Prot Chart" 6. [1S points] Create a pirot chart chowing the average boxes packed br emplogee for Mar and Apni 1.e, ezch emplores will have tro columns, sout 10 bars on the chat, 1. Oa the pinot chart fields: 1. If pomt! Uise Emploree and Montht at Axt: Categones 2. [Spointi] Uis Arerzege bores per empioree as raluas: wis worked and boxes A3 > f Hours worked and boxes Dinaza Advancod Tienquato