please help
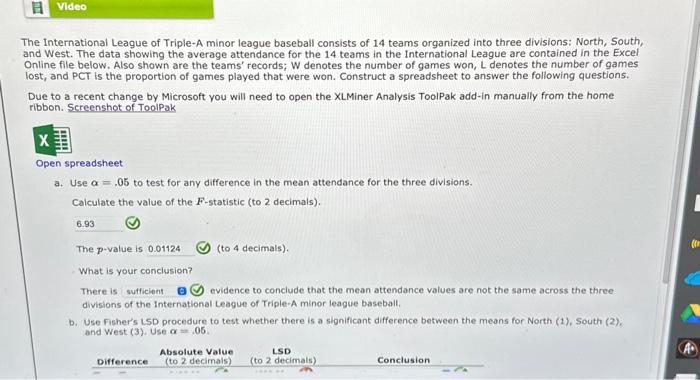
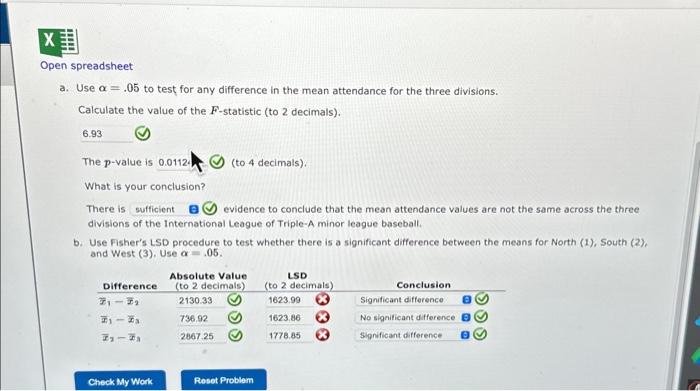
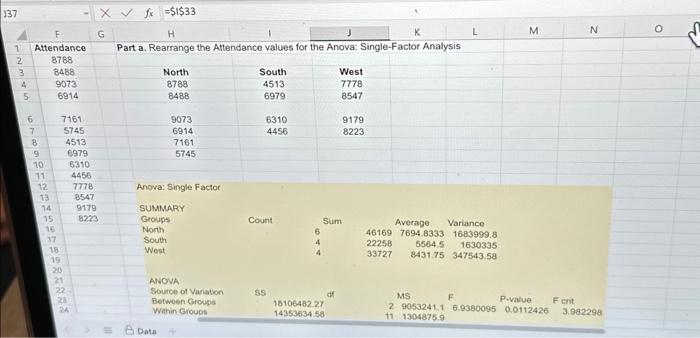
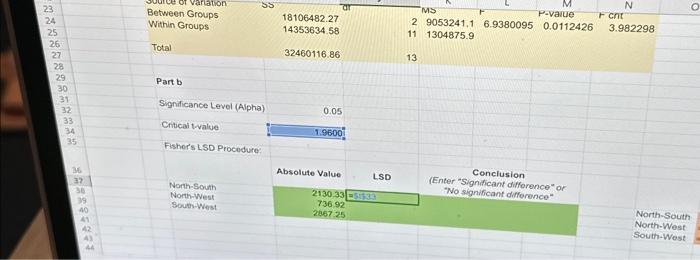
e International League of Triple-A minor league baseball consists of 14 teams organized into three divisions: North, South, Id West. The data showing the average attendance for the 14 teams in the International League are contained in the Excel nline file below. Also shown are the teams' records; W denotes the number of games won, L denotes the number of games st, and PCT is the proportion of games played that were won. Construct a spreadsheet to answer the following questions. oue to a recent change by Microsoft you will need to open the XLMiner Analysis ToolPak add-in manually from the home ibbon. Screenshot of Toolpak Open spreadsheet a. Use =.05 to test for any difference in the mean attendance for the three divisions. Calculate the value of the F-statistic (to 2 decimals). The p-value is (to 4 decimals). What is your conciusion? There is evidence to conclude that the mean attendance values are not the same across the three divisions of the international League of Triple-A minor league baseball. b. Use Fisher's LSD procedure to test whether there is a significant difference between the means for North (1), South (2), and West (3). Use =.05 a. Use =.05 to test for any difference in the mean attendance for the three divisions. Calculate the value of the F-statistic (to 2 decimals). The p-value is 0.0112( (to 4 decimals). What is your conclusion? There is evidence to conclude that the mean attendance values are not the same across the three divisions of the International League of Triple-A minor league baseball. b. Use Fisher's LSD procedure to test whether there is a significant difference between the means for North (1), South (2), and West (3), Use =.05. Part a. Rearrange the Attendance values for the Anova: Single-Factor Analysis Part b Significance Level (Alpha) 0.05 Critical walue Fisher's LSD Procedure: North-South North-West South-West e International League of Triple-A minor league baseball consists of 14 teams organized into three divisions: North, South, Id West. The data showing the average attendance for the 14 teams in the International League are contained in the Excel nline file below. Also shown are the teams' records; W denotes the number of games won, L denotes the number of games st, and PCT is the proportion of games played that were won. Construct a spreadsheet to answer the following questions. oue to a recent change by Microsoft you will need to open the XLMiner Analysis ToolPak add-in manually from the home ibbon. Screenshot of Toolpak Open spreadsheet a. Use =.05 to test for any difference in the mean attendance for the three divisions. Calculate the value of the F-statistic (to 2 decimals). The p-value is (to 4 decimals). What is your conciusion? There is evidence to conclude that the mean attendance values are not the same across the three divisions of the international League of Triple-A minor league baseball. b. Use Fisher's LSD procedure to test whether there is a significant difference between the means for North (1), South (2), and West (3). Use =.05 a. Use =.05 to test for any difference in the mean attendance for the three divisions. Calculate the value of the F-statistic (to 2 decimals). The p-value is 0.0112( (to 4 decimals). What is your conclusion? There is evidence to conclude that the mean attendance values are not the same across the three divisions of the International League of Triple-A minor league baseball. b. Use Fisher's LSD procedure to test whether there is a significant difference between the means for North (1), South (2), and West (3), Use =.05. Part a. Rearrange the Attendance values for the Anova: Single-Factor Analysis Part b Significance Level (Alpha) 0.05 Critical walue Fisher's LSD Procedure: North-South North-West South-West