please help explain. this is just a review but we are going over it in clSs on momday and I need to have some sort of understanding before discussion
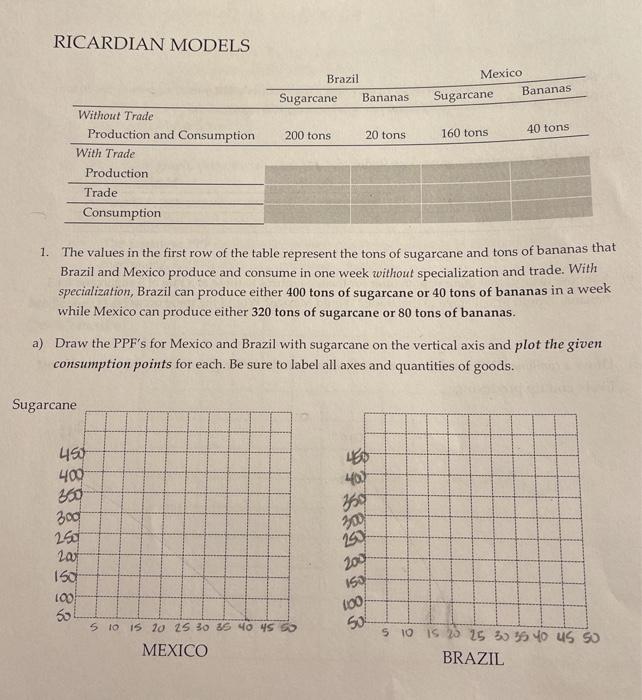
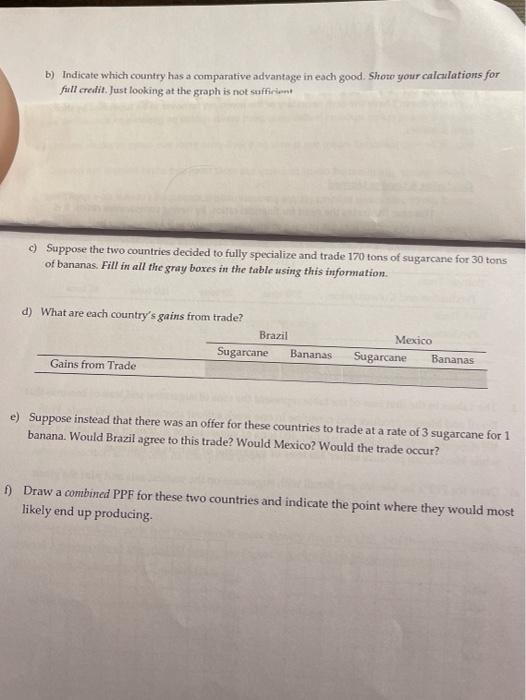
RICARDIAN MODELS Brazil Sugarcane Bananas Mexico Sugarcane Bananas 200 tons 40 tons 20 tons 160 tons Without Trade Production and Consumption With Trade Production Trade Consumption 1. The values in the first row of the table represent the tons of sugarcane and tons of bananas that Brazil and Mexico produce and consume in one week without specialization and trade. With specialization, Brazil can produce either 400 tons of sugarcane or 40 tons of bananas in a week while Mexico can produce either 320 tons of sugarcane or 80 tons of bananas. a) Draw the PPF's for Mexico and Brazil with sugarcane on the vertical axis and plot the given consumption points for each. Be sure to label all axes and quantities of goods. Sugarcane 450 400 40.) 350 300 250 200 150 100 50 300 299 200 153 100 50 510 5 10 15 20 25 30 35 40 45 5 MEXICO IS 25 25 30 540 us 50 BRAZIL b) Indicate which country has a comparative advantage in each good. Shoto your calailations for full credit. Just looking at the graph is not sufficient c) Suppose the two countries decided to fully specialize and trade 170 tons of sugarcane for 30 tons of bananas. Fill in all the gray boxes in the table using this information. d) What are each country's gains from trade? Brazil Sugarcane Bananas Gains from Trade Mexico Sugarcane Bananas e) Suppose instead that there was an offer for these countries to trade at a rate of 3 sugarcane for 1 banana. Would Brazil agree to this trade? Would Mexico? Would the trade occur? A) Draw a combined PPF for these two countries and indicate the point where they would most likely end up producing. 2. Much of the trade in the 1800s could be described using Ricardian models. Suggest one good in which Japan seemed to have a comparative advantage in the 1800s as well as one in which they seemed to benefit from imports. RICARDIAN MODELS Brazil Sugarcane Bananas Mexico Sugarcane Bananas 200 tons 40 tons 20 tons 160 tons Without Trade Production and Consumption With Trade Production Trade Consumption 1. The values in the first row of the table represent the tons of sugarcane and tons of bananas that Brazil and Mexico produce and consume in one week without specialization and trade. With specialization, Brazil can produce either 400 tons of sugarcane or 40 tons of bananas in a week while Mexico can produce either 320 tons of sugarcane or 80 tons of bananas. a) Draw the PPF's for Mexico and Brazil with sugarcane on the vertical axis and plot the given consumption points for each. Be sure to label all axes and quantities of goods. Sugarcane 450 400 40.) 350 300 250 200 150 100 50 300 299 200 153 100 50 510 5 10 15 20 25 30 35 40 45 5 MEXICO IS 25 25 30 540 us 50 BRAZIL b) Indicate which country has a comparative advantage in each good. Shoto your calailations for full credit. Just looking at the graph is not sufficient c) Suppose the two countries decided to fully specialize and trade 170 tons of sugarcane for 30 tons of bananas. Fill in all the gray boxes in the table using this information. d) What are each country's gains from trade? Brazil Sugarcane Bananas Gains from Trade Mexico Sugarcane Bananas e) Suppose instead that there was an offer for these countries to trade at a rate of 3 sugarcane for 1 banana. Would Brazil agree to this trade? Would Mexico? Would the trade occur? A) Draw a combined PPF for these two countries and indicate the point where they would most likely end up producing. 2. Much of the trade in the 1800s could be described using Ricardian models. Suggest one good in which Japan seemed to have a comparative advantage in the 1800s as well as one in which they seemed to benefit from imports