

Question: Please help fix the code and help answer the challenge question. Thank you. Understanding the problem For this problem set we will be working with
Please help fix the code and help answer the challenge question. Thank you.
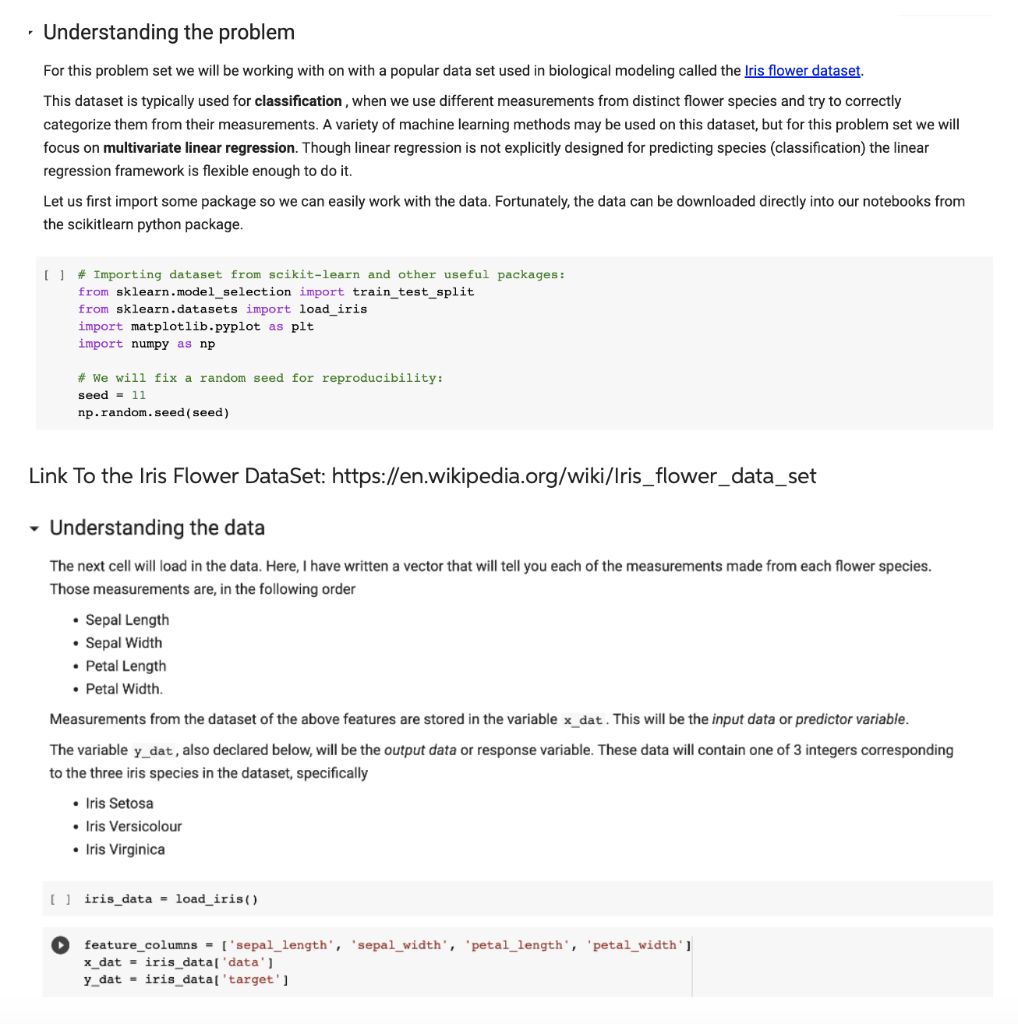
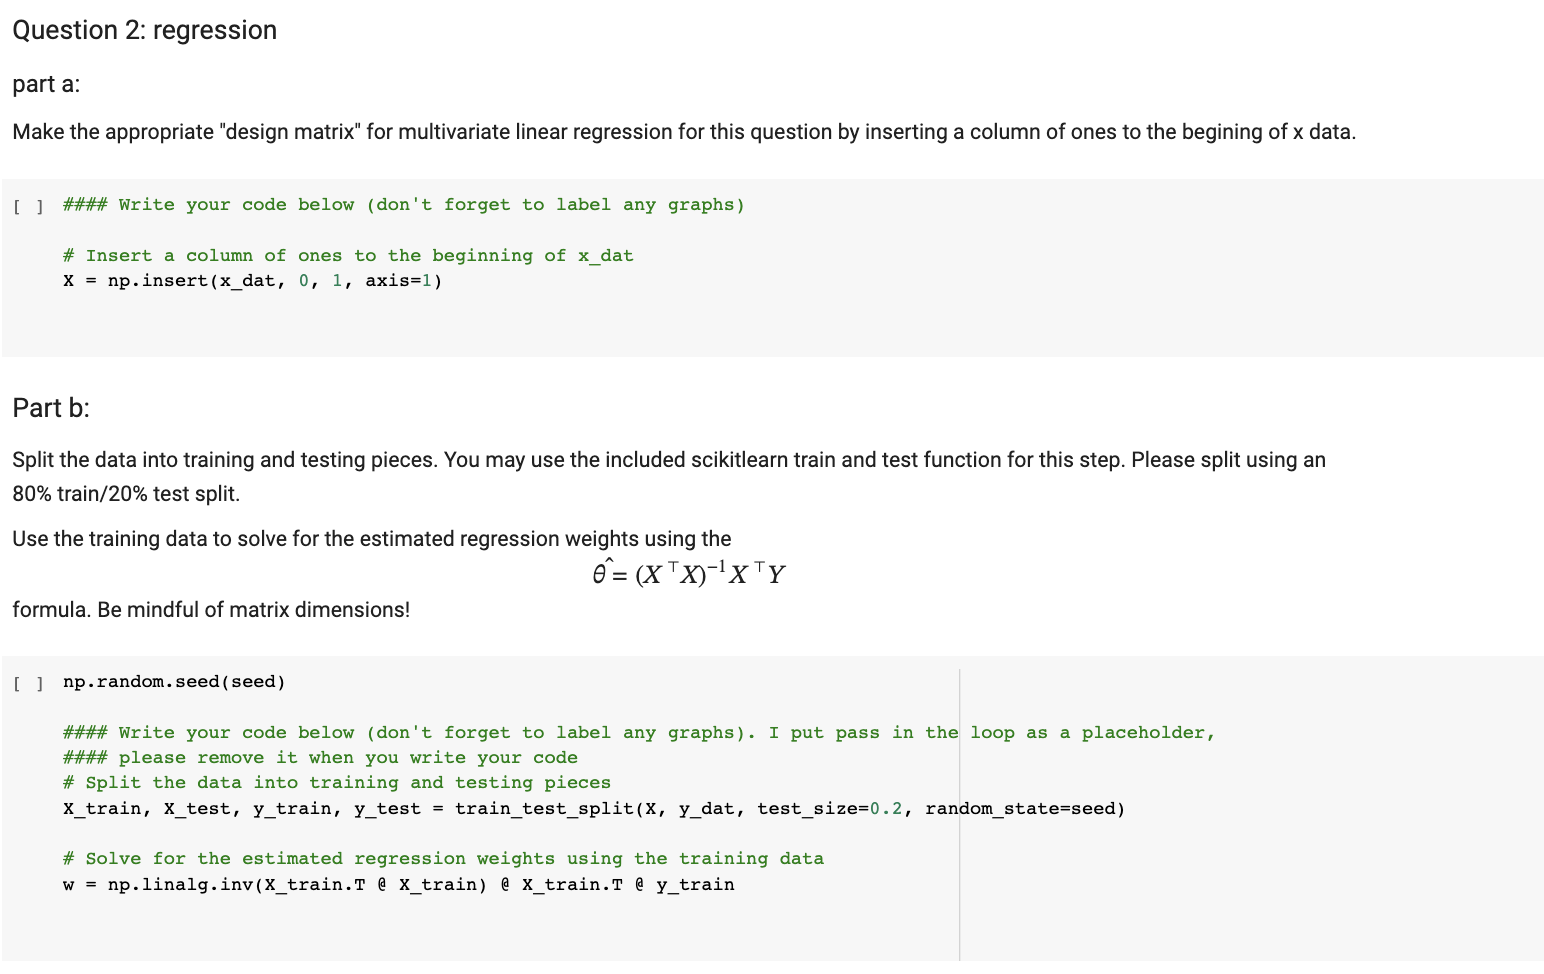
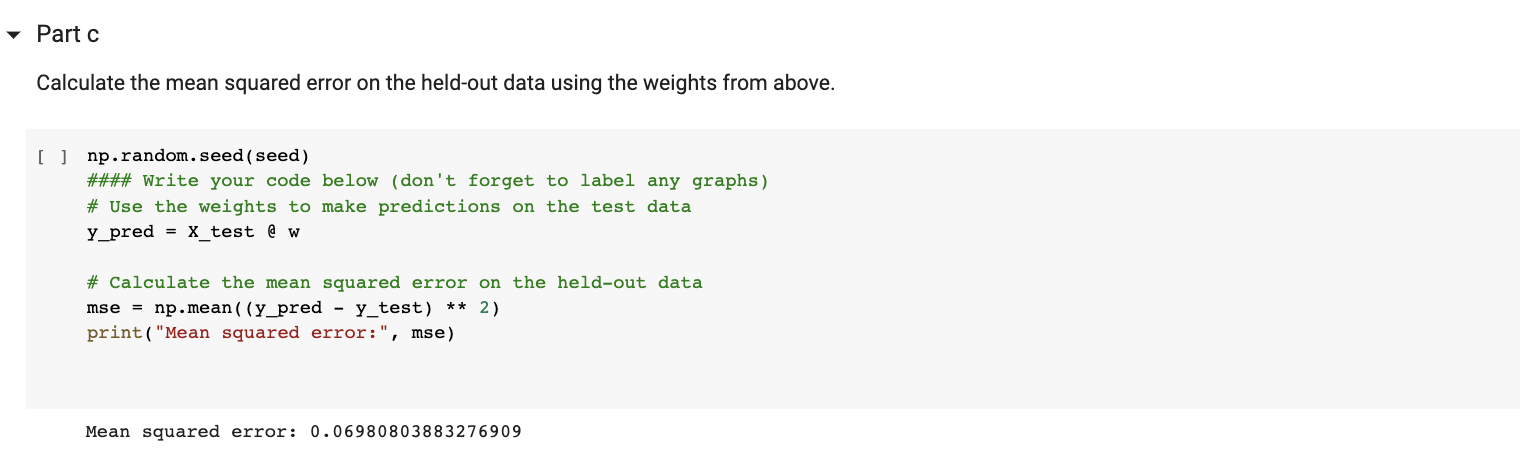
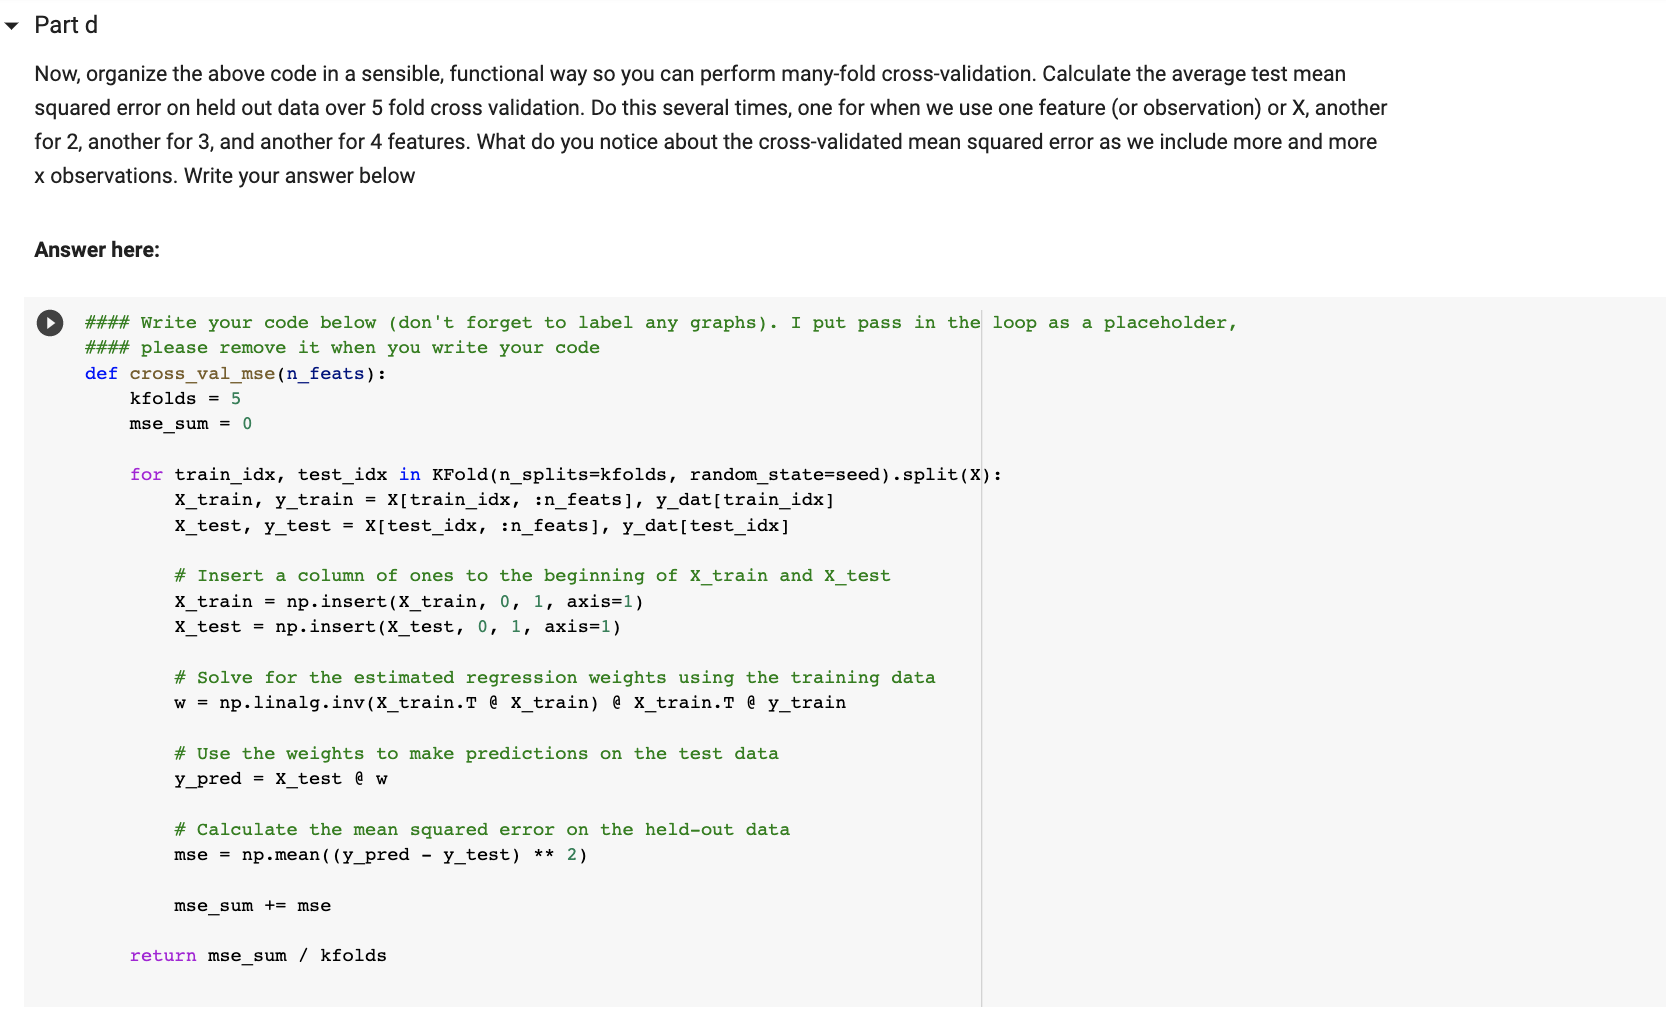
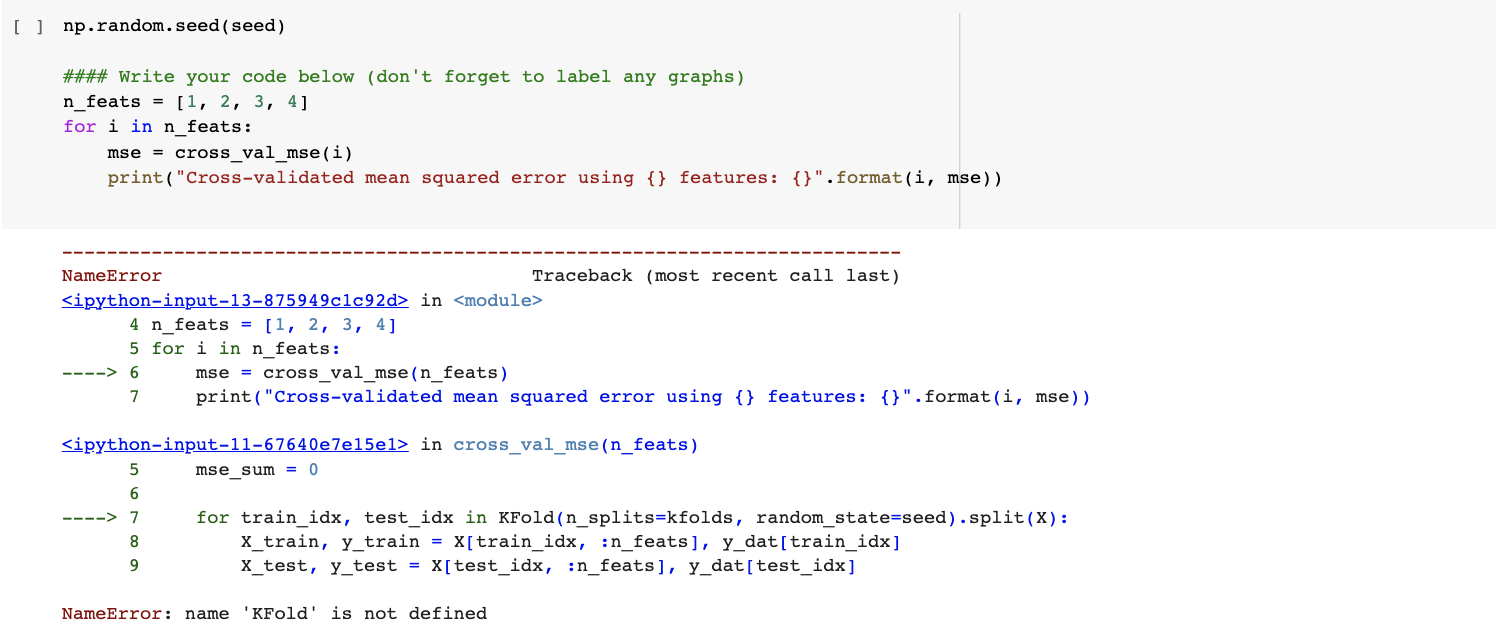
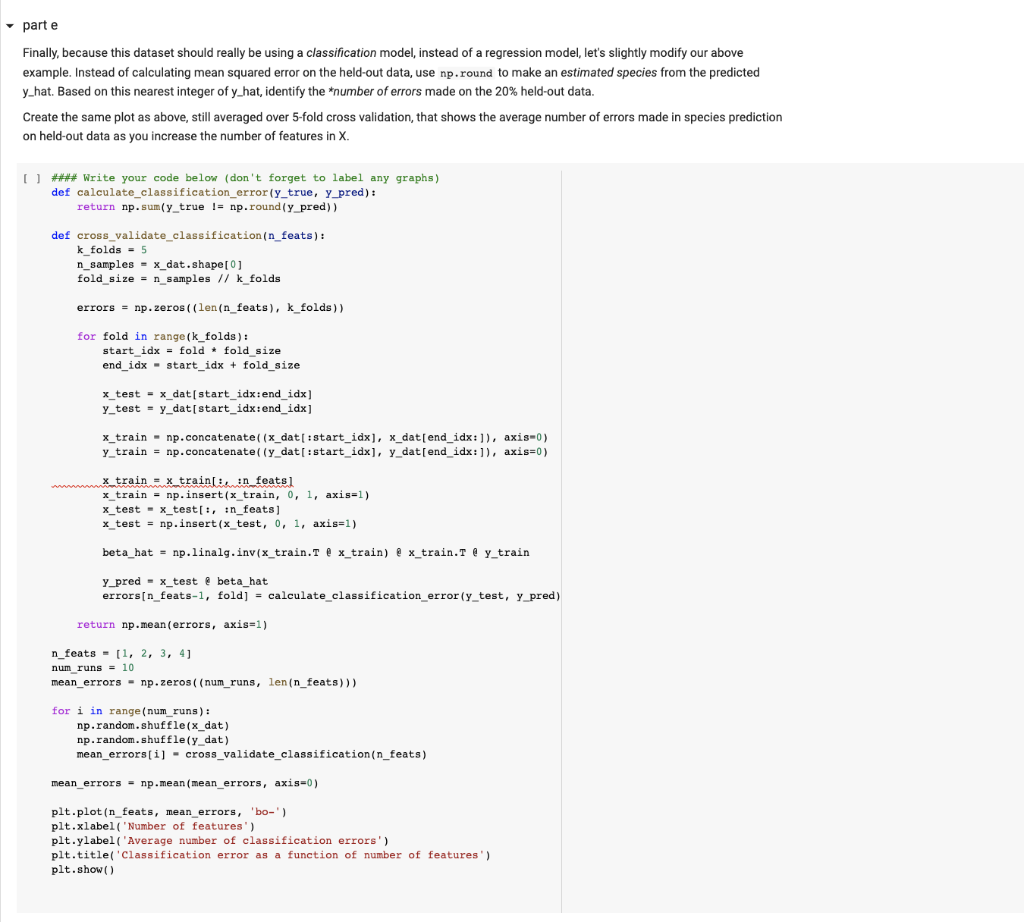
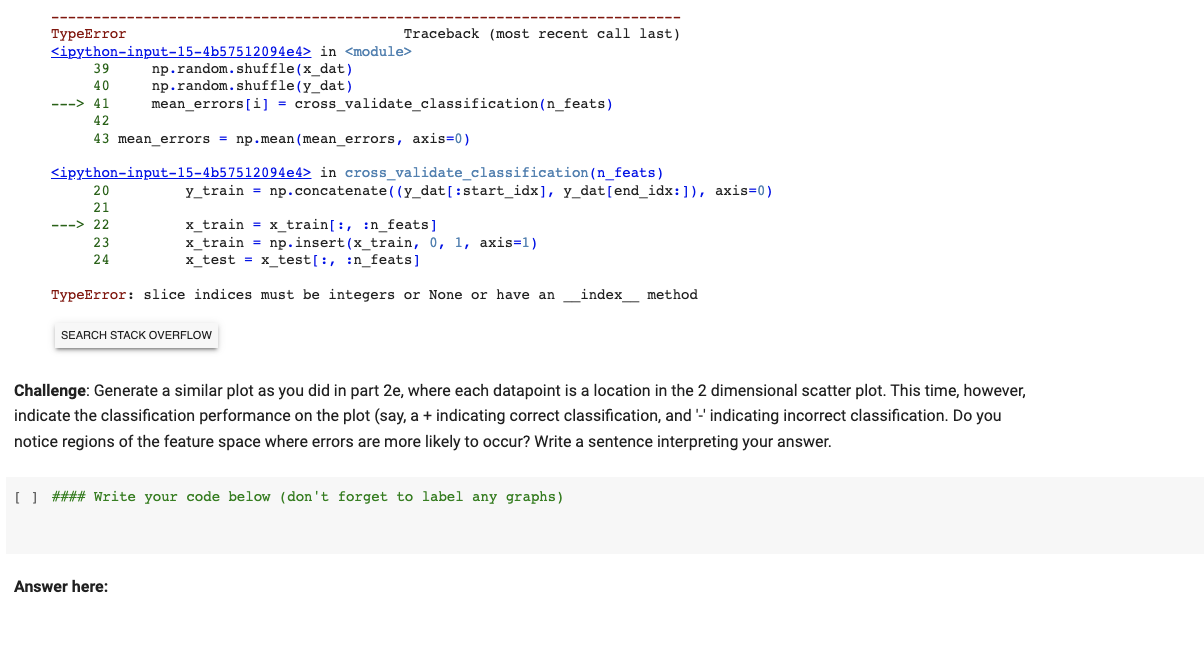
Understanding the problem For this problem set we will be working with on with a popular data set used in biological modeling called the Iris flower dataset. This dataset is typically used for classification, when we use different measurements from distinct flower species and try to correctly categorize them from their measurements. A variety of machine learning methods may be used on this dataset, but for this problem set we will focus on multivariate linear regression. Though linear regression is not explicitly designed for predicting species (classification) the linear regression framework is flexible enough to do it. Let us first import some package so we can easily work with the data. Fortunately, the data can be downloaded directly into our notebooks from the scikitlearn python package. [ ] \# Importing dataset from scikit-learn and other useful packages: from sklearn.model_selection import train_test_split from sklearn.datasets import load_iris import matplotlib.pyplot as plt import numpy as np \# We will fix a random seed for reproducibility: seed = 11 np.random.seed(seed) Link To the Iris Flower DataSet: https://en.wikipedia.org/wiki/lris_flower_data_set - Understanding the data The next cell will load in the data. Here, I have written a vector that will tell you each of the measurements made from each flower species. Those measurements are, in the following order - Sepal Length - Sepal Width - Petal Length - Petal Width. Measurements from the dataset of the above features are stored in the variable x dat. This will be the input data or predictor variable. The variable y_dat, also declared below, will be the output data or response variable. These data will contain one of 3 integers corresponding to the three iris species in the dataset, specifically - Iris Setosa - Iris Versicolour - Iris Virginica Question 2: regression part a: Make the appropriate "design matrix" for multivariate linear regression for this question by inserting a column of ones to the begining of x data. [ ] \#\#\#\# Write your code below (don't forget to label any graphs) \# Insert a column of ones to the beginning of x dat x=np.insert(x_dat,0,1,axis=1) Part b: Split the data into training and testing pieces. You may use the included scikitlearn train and test function for this step. Please split using an 80% train /20% test split. Use the training data to solve for the estimated regression weights using the ^=(XX)1XY formula. Be mindful of matrix dimensions! [ ] np.random.seed(seed) \#\#\#\# Write your code below (don't forget to label any graphs). I put pass in the loop as a placeholder, \#\#\#\# please remove it when you write your code \# Split the data into training and testing pieces X_train, X_test, y_train, y_test = train_test_split(X, y_dat, test_size=0.2, random_state=seed) \# Solve for the estimated regression weights using the training data w = np.linalg.inv(X_train.T a X_train) a X_train.T a y_train [] ] np.random.seed(seed) \#\#\#\# Write your code below (don't forget to label any graphs) \# Use the weights to make predictions on the test data y_pred = x_test a w \# Calculate the mean squared error on the held-out data mse = np.mean((y_pred - y_test) 2 ) print("Mean squared error:", mse) Part d Now, organize the above code in a sensible, functional way so you can perform many-fold cross-validation. Calculate the average test mean squared error on held out data over 5 fold cross validation. Do this several times, one for when we use one feature (or observation) or X, another for 2 , another for 3 , and another for 4 features. What do you notice about the cross-validated mean squared error as we include more and more x observations. Write your answer below Answer here: \#\#\#\# Write your code below (don't forget to label any graphs). I put pass in the loop as a placeholder, \#\#\#\# please remove it when you write your code def cross_val_mse(n_feats): kfolds=5 mse_sum =0 for train_idx, test_idx in KFold(n_splits=kfolds, random_state=seed).split (X): xtrain,y_train=x[train_idx,:n_feats],y_dat[train_idx] x _test, y _test =x[ test_idx, : n_feats], y _dat [ test_idx] \# Insert a column of ones to the beginning of x _train and x _test xtrain =np.insert(xtrain,0,1,axis=1) \( x_{\text {_test }}=n p \). insert (xtest ,0,1,axis=1) \# Solve for the estimated regression weights using the training data \# Use the weights to make predictions on the test data y_pred =x test aw \# Calculate the mean squared error on the held-out data mse = np.mean ((y_pred \( \left.\left.-y_{\text {_test }} ight) * * 2 ight) \) mse_sum += mse return mse_sum / kfolds part e Finally, because this dataset should really be using a classification model, instead of a regression model, let's slightly modify our above example. Instead of calculating mean squared error on the held-out data, use np.round to make an estimated species from the predicted y_hat. Based on this nearest integer of y _hat, identify the *number of errors made on the 20% held-out data. Create the same plot as above, still averaged over 5-fold cross validation, that shows the average number of errors made in species prediction on held-out data as you increase the number of features in X. Challenge: Generate a similar plot as you did in part 2e, where each datapoint is a location in the 2 dimensional scatter plot. This time, however, ndicate the classification performance on the plot (say, a + indicating correct classification, and '-' indicating incorrect classification. Do you hotice regions of the feature space where errors are more likely to occur? Write a sentence interpreting your answer. ] \#\#\#\# Write your code below (don't forget to label any graphs) Answer here
Step by Step Solution
There are 3 Steps involved in it

Get step-by-step solutions from verified subject matter experts