

Answered step by step
Verified Expert Solution
Question
1 Approved Answer
please help for a good rating! show excel functions! 2 Consider the following information. Your portfolio is invested 30 percent each in A and C,
please help for a good rating! show excel functions! 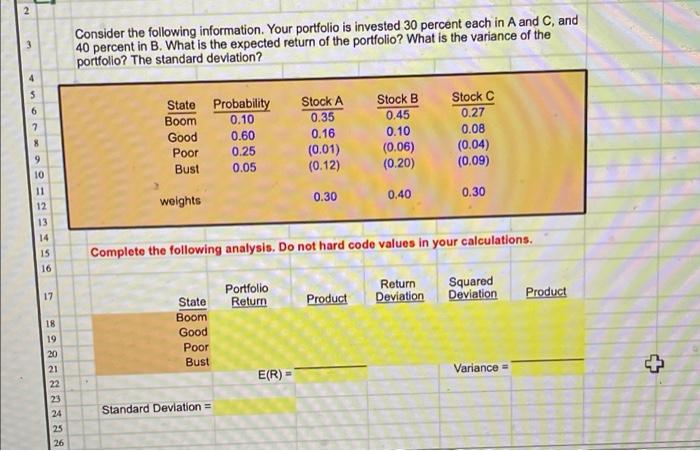
2 Consider the following information. Your portfolio is invested 30 percent each in A and C, and 40 percent in B. What is the expected return of the portfolio? What is the variance of the portfolio? The standard deviation? 4 $ 6 7 State Probability Boom 0.10 Good 0.60 Poor 0.25 Bust 0.05 Stock A 0.35 0.16 (0.01) (0.12) Stock B 0,45 0.10 (0.06) (0.20) Stock C 0.27 0.08 (0.04) (0.09) 8 9 10 11 12 0.30 0.40 0.30 weights 13 14 15 16 Complete the following analysis. Do not hard code values in your calculations. Portfolio Return 17 Product Return Deviation Squared Deviation Product State Boom Good Poor Bust Variance - + E(R) 18 19 20 21 22 23 24 25 26 Standard Deviation = Step by Step Solution
There are 3 Steps involved in it
Step: 1

Get Instant Access to Expert-Tailored Solutions
See step-by-step solutions with expert insights and AI powered tools for academic success
Step: 2

Step: 3
Ace Your Homework with AI
Get the answers you need in no time with our AI-driven, step-by-step assistance
Get Started
The Everything Guide To Day Trading
Authors: David Borman
1st Edition
1440506213, 978-1440506215