Answered step by step
Verified Expert Solution
Question
1 Approved Answer
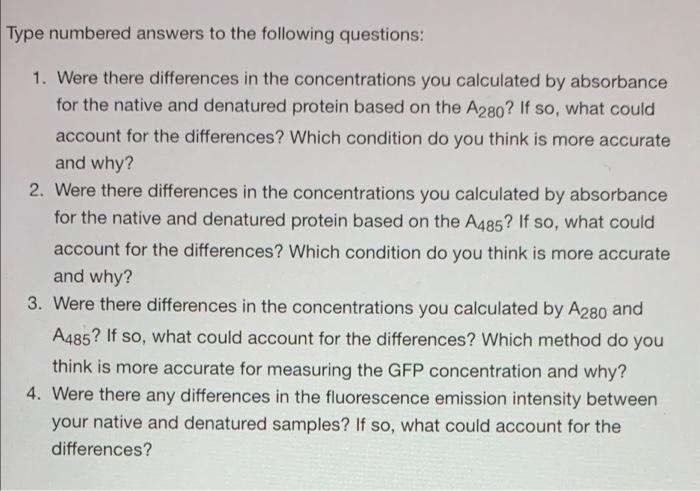
Please help! i attached the accompanying data tables for the questions Type numbered answers to the following questions: 1. Were there differences in the concentrations
Please help! i attached the accompanying data tables for the questions 


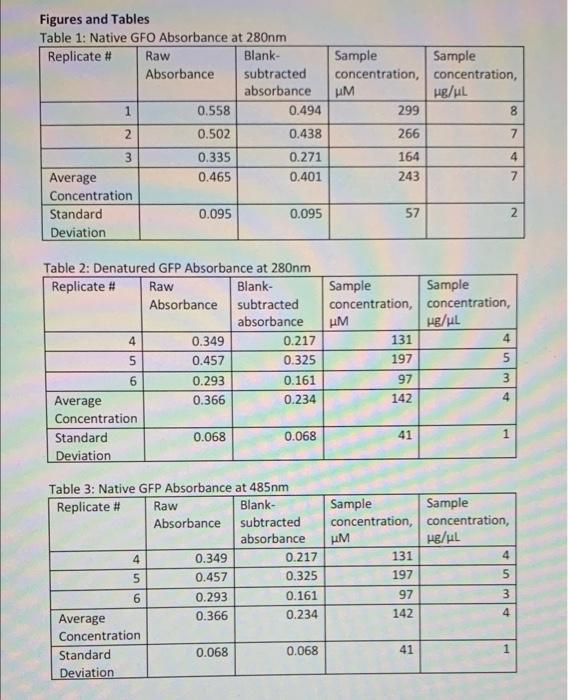
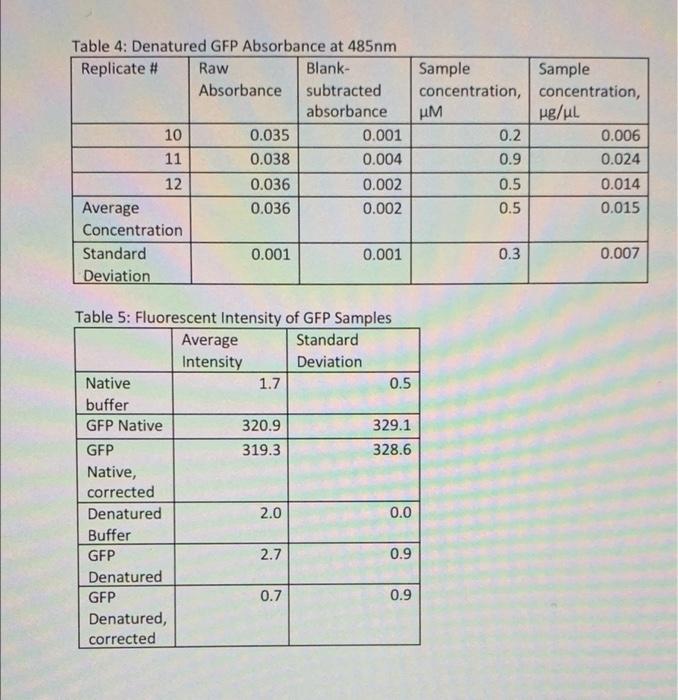
Type numbered answers to the following questions: 1. Were there differences in the concentrations you calculated by absorbance for the native and denatured protein based on the A280? If so, what could account for the differences? Which condition do you think is more accurate and why? 2. Were there differences in the concentrations you calculated by absorbance for the native and denatured protein based on the A485? If so, what could account for the differences? Which condition do you think is more accurate and why? 3. Were there differences in the concentrations you calculated by A280 and A485? If so, what could account for the differences? Which method do you think is more accurate for measuring the GFP concentration and why? 4. Were there any differences in the fluorescence emission intensity between your native and denatured samples? If so, what could account for the differences? Figures and Tables Table 1: Native GFO Absorbance at 280nm Replicate # Raw Blank- Absorbance subtracted absorbance 1 0.558 0.494 2 0.502 0.438 3 0.335 0.271 Average 0.465 0.401 Concentration Standard 0.095 0.095 Deviation Sample Sample concentration, concentration, UM ug/L 299 8 266 7 164 4 243 7 57 2. UM Table 2: Denatured GFP Absorbance at 280nm Replicate # Raw Blank- Absorbance subtracted absorbance 4 0.349 0.217 5 0.457 0.325 6 0.293 0.161 Average 0.366 0.234 Concentration Standard 0.068 0.068 Deviation Sample Sample concentration, concentration, ug/ul 131 4 197 5 97 3 142 4 41 1 Table 3: Native GFP Absorbance at 485nm Replicate # Raw Blank- Absorbance subtracted absorbance 4 0.349 0.217 5 0.457 0.325 6 0.293 0.161 Average 0.366 0.234 Concentration Standard 0.068 0.068 Deviation Sample Sample concentration, concentration, UM ug/ul 131 4 197 5 97 3 142 4 41 1 Table 4: Denatured GFP Absorbance at 485nm Replicate # Raw Blank- Absorbance subtracted absorbance 10 0.035 0.001 11 0.038 0.004 12 0.036 0.002 Average 0.036 0.002 Concentration Standard 0.001 0.001 Deviation Sample Sample concentration, concentration, UM g/ 0.2 0.006 0.9 0.024 0.5 0.014 0.5 0.015 0.3 0.007 Table 5: Fluorescent Intensity of GFP Samples Average Standard Intensity Deviation Native 1.7 0.5 buffer GFP Native 320.9 329.1 GFP 319.3 328.6 Native, corrected Denatured 2.0 0.0 Buffer GFP 2.7 0.9 Denatured GFP 0.7 0.9 Denatured, corrected Type numbered answers to the following questions: 1. Were there differences in the concentrations you calculated by absorbance for the native and denatured protein based on the A280? If so, what could account for the differences? Which condition do you think is more accurate and why? 2. Were there differences in the concentrations you calculated by absorbance for the native and denatured protein based on the A485? If so, what could account for the differences? Which condition do you think is more accurate and why? 3. Were there differences in the concentrations you calculated by A280 and A485? If so, what could account for the differences? Which method do you think is more accurate for measuring the GFP concentration and why? 4. Were there any differences in the fluorescence emission intensity between your native and denatured samples? If so, what could account for the differences? Figures and Tables Table 1: Native GFO Absorbance at 280nm Replicate # Raw Blank- Absorbance subtracted absorbance 1 0.558 0.494 2 0.502 0.438 3 0.335 0.271 Average 0.465 0.401 Concentration Standard 0.095 0.095 Deviation Sample Sample concentration, concentration, UM ug/L 299 8 266 7 164 4 243 7 57 2. UM Table 2: Denatured GFP Absorbance at 280nm Replicate # Raw Blank- Absorbance subtracted absorbance 4 0.349 0.217 5 0.457 0.325 6 0.293 0.161 Average 0.366 0.234 Concentration Standard 0.068 0.068 Deviation Sample Sample concentration, concentration, ug/ul 131 4 197 5 97 3 142 4 41 1 Table 3: Native GFP Absorbance at 485nm Replicate # Raw Blank- Absorbance subtracted absorbance 4 0.349 0.217 5 0.457 0.325 6 0.293 0.161 Average 0.366 0.234 Concentration Standard 0.068 0.068 Deviation Sample Sample concentration, concentration, UM ug/ul 131 4 197 5 97 3 142 4 41 1 Table 4: Denatured GFP Absorbance at 485nm Replicate # Raw Blank- Absorbance subtracted absorbance 10 0.035 0.001 11 0.038 0.004 12 0.036 0.002 Average 0.036 0.002 Concentration Standard 0.001 0.001 Deviation Sample Sample concentration, concentration, UM g/ 0.2 0.006 0.9 0.024 0.5 0.014 0.5 0.015 0.3 0.007 Table 5: Fluorescent Intensity of GFP Samples Average Standard Intensity Deviation Native 1.7 0.5 buffer GFP Native 320.9 329.1 GFP 319.3 328.6 Native, corrected Denatured 2.0 0.0 Buffer GFP 2.7 0.9 Denatured GFP 0.7 0.9 Denatured, corrected 


Step by Step Solution
There are 3 Steps involved in it
Step: 1

Get Instant Access to Expert-Tailored Solutions
See step-by-step solutions with expert insights and AI powered tools for academic success
Step: 2

Step: 3

Ace Your Homework with AI
Get the answers you need in no time with our AI-driven, step-by-step assistance
Get Started


