

Answered step by step
Verified Expert Solution
Question
1 Approved Answer
Please help I dont even know where to start I dont know how to do the excel worksheet Completing this activity will help you learn
Please help I dont even know where to start 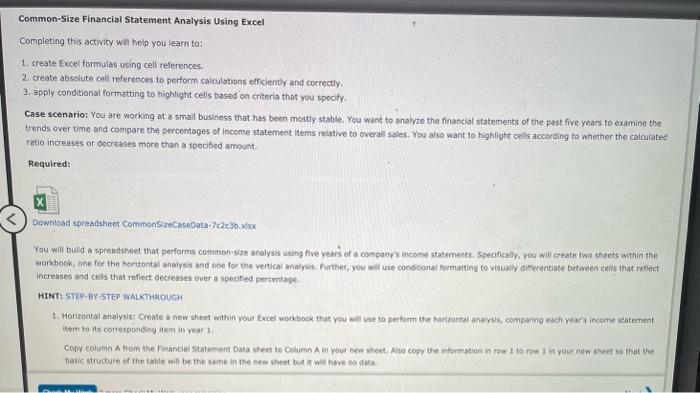
I dont know how to do the excel worksheet
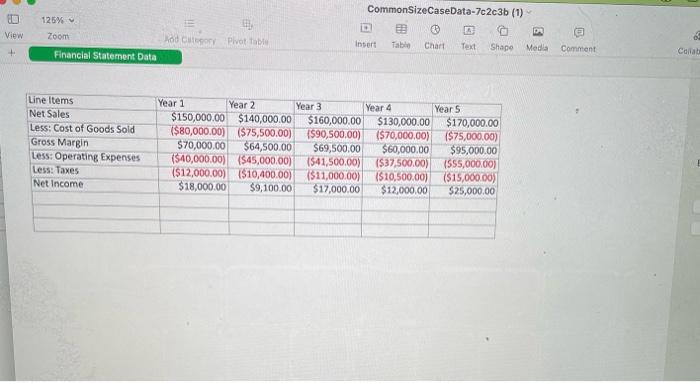
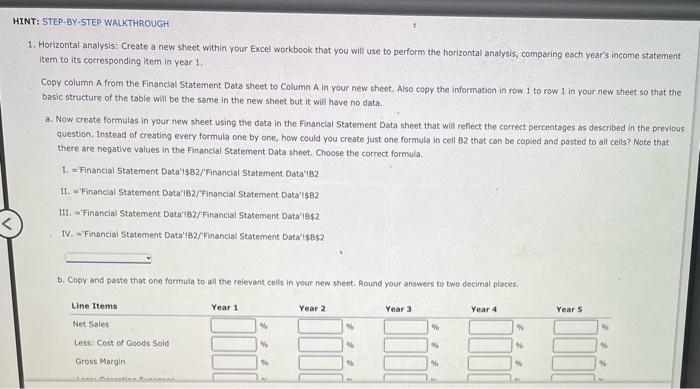
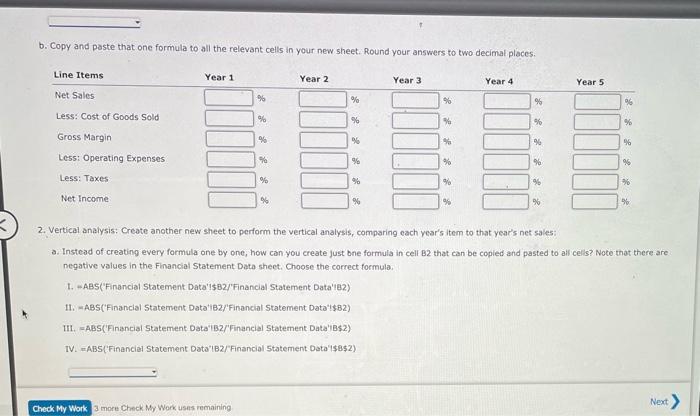
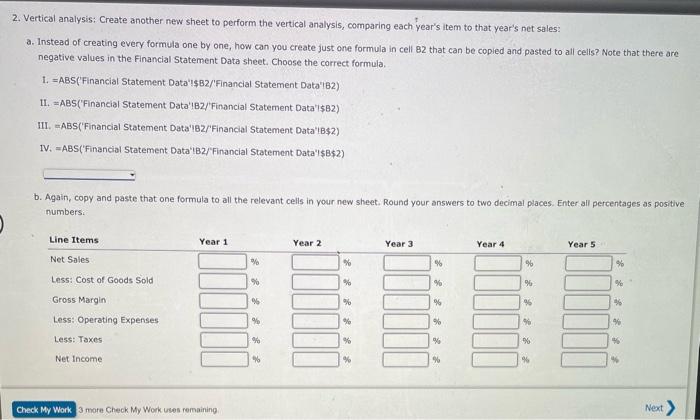
Completing this activity will help you learn to: 1. create Excel formulas using cell references; 2. create absolute call references to perform calculations efficiently and correctly. 3. apply conditional formatting to highlight celts based on criteria that you specify. Case scenario: You are working at a smail business that has been mostly stable. You want to analyze the financial statements of the past five years to examine the trends over time and compare the percentages of income statement items relative to overall sales. You also want to highlight cells according to whether the calculated ratio increases of decreases more than a specified amount. Requiredt Dewnload spreadsheet CommonsineCaseData-7c2c3b 15 You will buid a spreadsheet that performs common-size analysis using five years of a companys income statements. 5 pedifically, you will create two shects within the workbook, one for the horitontal analysis acd one for the vertical analyas. Further, you will use conditinat formatting to visuaily differentiate between ceils that reflect increases and ceas that reflect decreases over a specified percentage; HINT: STEP, BY.5TEP WALKTHHOUGH. 1. Horitantal analysis: Create a new sheet within your fucel workboek thyt you will use to perform the horizontal analysis, comparing ezch year' indeme staternent Werm to its corresponding item in year 1 . Copy colvenn A from the Financial statement Data steet to Column A in your new ahedt. Aho cosy the informatian in row 1 to fow 1 in your new sheet so that the thatic structure of the table will be the same in the nee sheet but at will have no data. CommonSizeCaseData 7c2c3b (1) Horizontal analysis: Create a new sheet within your Excel workbook that you will use to perform the horizontal analysis, comparing each year's income statement item to its corresponding item in year 1 . Cogy column A from the Financial Statement Data sheet to Column A in your new sheet. Also copy the information in row 1 to row 1 in your new sheet so that the basic structure of the table will be the same in the new sheet but it will have no data. a. Now create formulas in your new sheet using the data in the Financial Statement Data sheet that will reflect the correct percentages as described in the previous question. Instead of creating every formula one by one, how could you create just one formula in cell B2 that can be copled and pasted to all cells? Note that there are negative values in the Financlal Statement Data sheet. Choose the correct formula. 1. ='Financial Statement Data'1382JFinandal Statement Data'iB2 11. -'Financial Statement Data'4B2 FFinancial Statement Data'1\$82 1II. ='Financial Statement Data'iB2/'Financial Statement Data'18\$2. IV. = Financial Staternent Data'182/'Financial Statement Data'l5B52 b. Cony and paste that one formula to all the releyant cells in your new sheet. Round your answers to two decimal places. b. Copy and paste that one formula to all the relevant cells in your new sheet. Round your answers to two decimal places. 2. Vertical analysis: Greate another new sheet to perform the vertical analysis, comparing each year's item to that year's net sales: a. Instead of creating every formula one by one, how can you create just bne formula in cell B2 that can be copied and pasted to all cells? Note that there are negative values in the Financial Statement Data sheet. Choose the correct formula. 1. =ABS('Financial Statement Data'15B2/'Financial Statement Data'182) II. =ABSf'Financial Statement Data'iB2/'Financial Statement Data'13B2) III. =ABS('Financial Statement Data'iB2/'Financial Statement Data'lB\$2) IV. wABS[Financiel Statement Data'IB2/Financial 5tatement Data'1\$8\$2) Vertical analysis: Create another new sheet to perform the vertical analysis, comparing each year's item to that year's net sales: a. Instead of creating every formula one by one, how can you create just one formula in cell 82 that can be copied and pasted to all cells? Note that there are negative values in the Financial Statement Data sheet. Choose the correct formula. 1. =ABS('Financial Statement Data'1\$B2/'Financial Statement Data'1B2) II. =ABS('Financial Statement Data'lB2/'Financial Statement Data'15B2) III. =ABS ('Financial Statement Data'l82/'Financial Statement Data'1B\$2) IV. =ABS ('Financial Statement Data'lB2/Financial Statement Data'1\$B\$2) b. Again, copy and paste that one formula to all the relevant cells in your new sheet. Round your answers to two decimal places. Enter all percentages as positive numbers Step by Step Solution
There are 3 Steps involved in it
Step: 1

Get Instant Access to Expert-Tailored Solutions
See step-by-step solutions with expert insights and AI powered tools for academic success
Step: 2

Step: 3
Ace Your Homework with AI
Get the answers you need in no time with our AI-driven, step-by-step assistance
Get Started
Financial Accounting Tools for business decision making
Authors: Paul D. Kimmel, Jerry J. Weygandt, Donald E. Kieso
6th Edition
978-1119191674, 047053477X, 111919167X, 978-0470534779