

Answered step by step
Verified Expert Solution
Question
1 Approved Answer
Please help I have no idea how to do this question. Download monthly adjusted close price data for Apple and Google (Alphabet Inc.). for the
Please help I have no idea how to do this question.
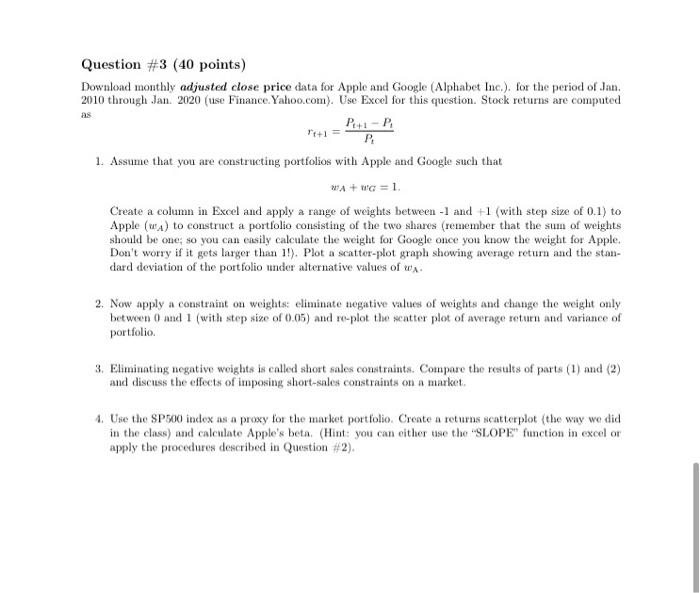
Download monthly adjusted close price data for Apple and Google (Alphabet Inc.). for the period of Jan.
2010 through Jan. 2020 (use Finance.Yahoo.com). Use Excel for this question. Stock returns are computed
as
rt+1 =
Pt+1 Pt
Pt
1. Assume that you are constructing portfolios with Apple and Google such that
wA + wG = 1.
Create a column in Excel and apply a range of weights between -1 and +1 (with step size of 0.1) to
Apple (wA) to construct a portfolio consisting of the two shares (remember that the sum of weights
should be one; so you can easily calculate the weight for Google once you know the weight for Apple.
Dont worry if it gets larger than 1!). Plot a scatter-plot graph showing average return and the stan-
dard deviation of the portfolio under alternative values of wA.
2. Now apply a constraint on weights: eliminate negative values of weights and change the weight only
between 0 and 1 (with step size of 0.05) and re-plot the scatter plot of average return and variance of
portfolio.
3. Eliminating negative weights is called short sales constraints. Compare the results of parts (1) and (2)
and discuss the effects of imposing short-sales constraints on a market.
4. Use the SP500 index as a proxy for the market portfolio. Create a returns scatterplot (the way we did
in the class) and calculate Apples beta.
Step by Step Solution
There are 3 Steps involved in it
Step: 1

Get Instant Access to Expert-Tailored Solutions
See step-by-step solutions with expert insights and AI powered tools for academic success
Step: 2

Step: 3
Ace Your Homework with AI
Get the answers you need in no time with our AI-driven, step-by-step assistance
Get Started
Mergers, Acquisitions and Other Restructuring Activities
Authors: Donald DePamphilis
8th edition
9780128024539, 128013907, 978-0128013908