please help. If you are unable to answer more than one question please do not reply. this is the best I could get the picture. will thumbs up.
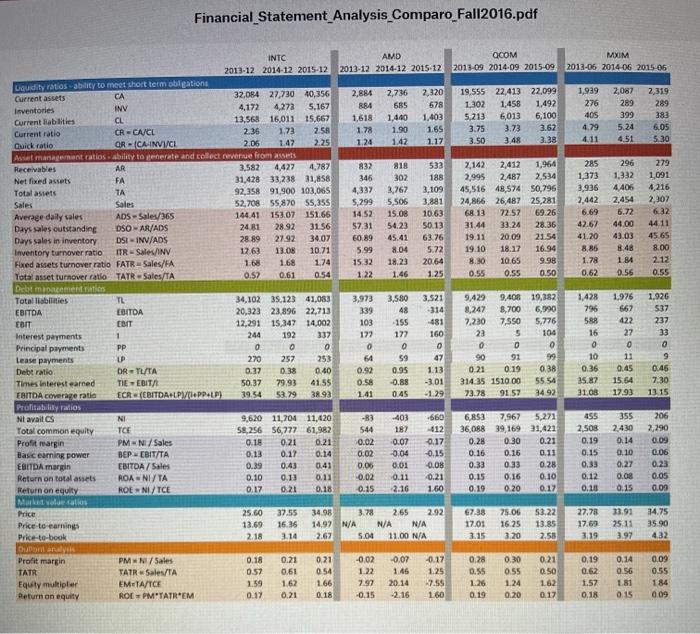
1.) what is the measure for the time to receive payment after a sale?
a. Quick Ratio
b. Days sales in Inventory
c. Days sales outstanding
d. Basic earning Power
2.) Do you want this measure higher or lowert?
a. higher
b. Lower
3.) Which Company performed best by this measure in 2015?
a. INTC
b. QCOM
c. MXIM
d. AMD
Financial Statement Analysis Comparo Fall2016.pdf MXIM 2013-06 2014-06 2015-06 INV 1,939 276 405 4.79 4.11 2,067 289 399 5.24 4.51 2,319 289 383 6.05 5.30 285 1,373 3,936 7,442 6.69 42.67 41.20 8.86 1.78 0.62 296 1,332 4.406 2,454 6.72 44.00 43.03 8.48 1.84 0.56 279 1,091 4,216 2,307 6.32 44 11 45.65 8.00 2.12 0.55 125 1.976 667 m INTC AMD QCOM 2013-12 2014-12 2015-12 2013-12 2014-12 2015-12 2013-09 2014-09 2015-09 Liquidity ratios ability to meet short term obligations Current assets CA 32,084 27,730 40,356 2,884 2,736 2,320 19,555 22.413 22,099 Inventories 4,172 4,272 5,167 884 685 578 1.302 1.458 1,492 Current liabilities CL 13,568 16,011 15.667 1,618 1.440 1.403 5,213 6,013 6.100 Current ratio CR - CAICL 2.36 1.73 258 1.78 1.90 1.65 3.75 3.73 3.62 Quick ratio ORCA INVI/CL 2.06 1.42 2.25 1.24 1.42 1.17 3.50 3.48 3.38 Asset management ratios ability to generate and collect revenue from Receivables AR 3,582 4,427 4,787 832 818 533 2,142 2,412 1,966 Net fixed assets FA 31,428 33,238 31,858 345 302 188 2,995 2,487 2,534 Total assets TA 92,358 91.900 103,065 4,337 2,767 3.109 45,516 48,574 50,796 Sales Sales 52,708 55,870 55,355 5,299 5,506 3,881 24,866 26,487 25,281 Average daily cales ADS-Sales/365 144.41 153.07 151.66 14.52 15.08 10.63 68.13 72.57 69.26 Days sales outstanding DSO-AR/ADS 24.81 28.92 31.56 57.31 54.23 50.13 31.44 33.24 28.36 Days sales in inventory DSI-INV/ADS 28.89 27.92 34.07 60.89 45.41 63.76 19.11 20.09 21.54 Inventory turnover ratio ITR -Sales/INV 12.63 13.08 10.71 5.99 8.04 5.72 19.10 18.17 16.94 Faxed assets turnover ratio FATR-Sales/FA 1.00 1.68 1.74 1532 18.23 20.64 8.30 10,65 9.98 Total asset turnover ratio TATR - Sales/TA 0.57 0.61 0.54 122 1.46 0.55 0.55 0.50 Debt mincements Totallisbilities TL 34,102 35.123 41,083 3,973 3,580 3,521 9429 9.406 19,382 EBITDA EBITDA 20,323 23.896 22,713 339 48 -314 8,247 8,700 6,990 EBIT COIT 12,291 15,347 14,002 103 -155 7,230 7.SSO 5,776 Interest payments 1 244 192 172 172 160 23 5 100 Principal payments PP 0 0 0 0 0 0 O 0 Lease payments UP 220 253 64 59 47 90 91 99 Debt ratio ORTLATA 0.37 0.38 0.40 0.92 0.95 1.13 0.21 0.19 0.38 Times Interest earned TIE-EBITA 50.37 79.93 4155 0.58 -0.88 314.35 1510.00 55 54 EBITDA coverage ratio ECREBITDA+LPMHPP+LP) 39.54 53.79 38.93 1.41 0.45 -1.29 73.78 91 57 9492 Profisabilily ratios Nl avail CS NI 9,620 11,704 11,420 -403 -660 6,853 7,967 5,271 Total common equity TCE 58.256 56,777 61,982 544 182 -412 36,088 39,169 31,421 Profit margin PM-NI/Sales 0.18 0.21 0.21 0.02 0.07 -0.17 0.28 0.30 0.21 lascearning power BEPEBIT/TA 0.13 0.17 0.14 0.02 -0.04 -0,15 0.16 0.16 0.11 EBITDA margin EBITOA /Sales 0.39 0.43 0.41 0.06 0.01 -0.08 0.33 033 0.28 Return on total assets ROANI/TA 0.10 0.13 0.11 -0.02 0.11 0.21 0.15 0.16 0.10 Return on equity ROENI/TCE 0.17 0.21 0.18 0.15 2.16 1.60 0.19 0.20 0.17 Market value callos Price 25.60 37.55 3498 3.78 265 2.92 67.38 75.06 53.22 Price to earnings 13.69 16.36 14.97 N/A N/A 16.25 13.85 Price-to-book 2.18 3.14 2.62 5.04 11.00 N/A 3.15 3.20 2.53 Duonyek PMN /Sales 0.18 0.21 0.21 -0.02 -0.07 -0.17 0.28 0.30 0.21 TATR TATR Sales/TA 0.57 0.61 054 1.22 1.46 1.25 0.55 0.55 0.50 Equity multiplier EMTA/TCE 1.59 1.62 1.66 7.97 20.14 17.55 1.26 1.24 162 Return on equity ROEPM'TATR'EM 0.17 0.21 0.18 0.15 -2.16 160 0.19 0.20 0.17 1.428 796 588 16 0 10 0.36 35.87 31.08 1.926 $37 237 33 o 9 0.46 7.30 13.15 27 0 11 0.45 15.64 17.93 257 -3.01 455 2,508 0.19 0.15 0.33 0.12 0.18 355 2.430 0.14 0.10 0.27 0.00 206 2,290 0.09 0.06 0.23 0.05 0.09 0.15 NA 17.01 27,73 17.69 3.19 33.91 25.11 3.97 34.75 35.90 432 Profit margin 0.19 0.62 1.52 0.18 0.14 0.56 1.81 0.15 0.09 0.55 184 0.09