please help. If you are unable to answer more than one question please do not reply. this is the best I could get the picture. will thumbs up.
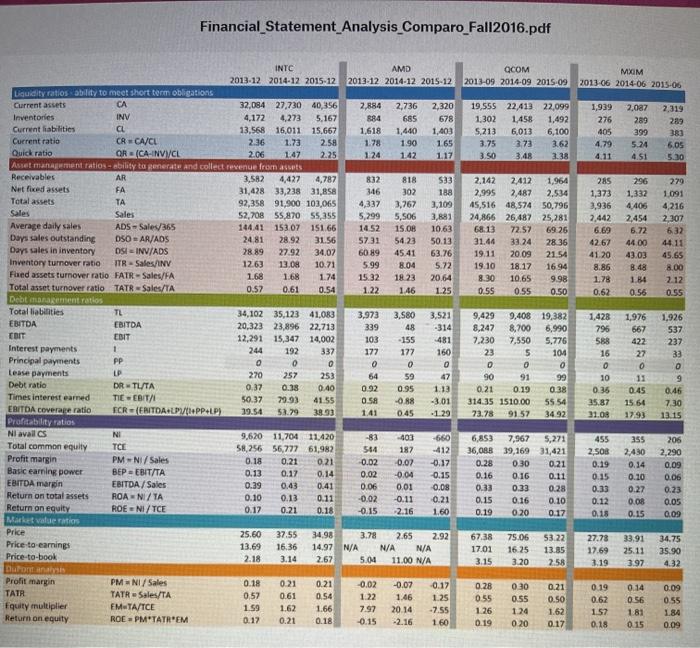
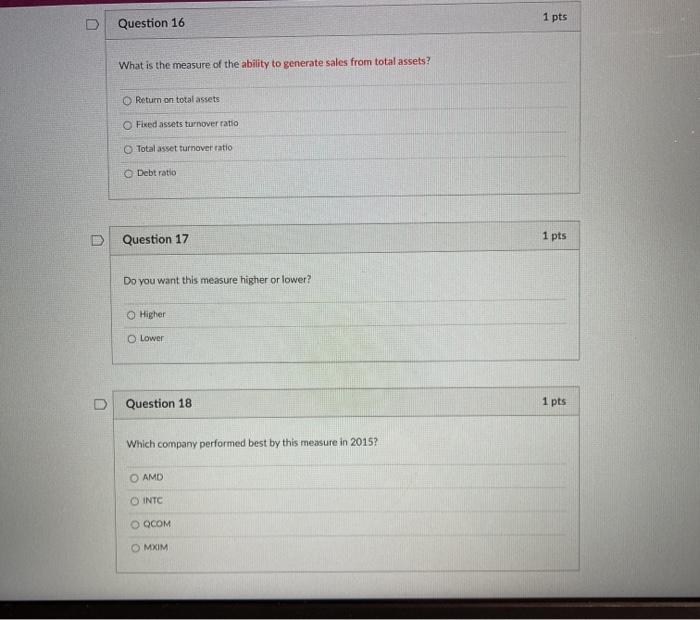
Financial Statement Analysis Comparo Fall2016.pdf 2,087 2,319 302 44.00 20.64 INTC AMD QCOM MXM 2013-12 2014-12 2015-12 2013-12 2014-12 2015-12 2013-09 2014-09 2015-09 2013-06 2014-06 2015-06 Liquidity ratios ability to meet short term obligations Current assets CA 32,084 27,730 40,356 2,884 2,736 2,320 19,555 22,413 22,099 1,939 Inventories INV 4.172 4,272 5.167 884 685 678 1.302 1.458 1,492 276 289 289 Current liabilities CL 13,568 16,011 15.667 1.618 1,440 1,403 5.213 6,013 6,100 405 399 383 Current ratio CACA/CL 2.36 1.73 2.58 1.78 1.90 165 3.75 3.73 2.62 4.79 5.24 6,05 Quick ratio OR (CA INVV/CL 2.06 1.47 2.25 124 142 117 3.50 3.48 2.38 4.11 4.51 5.30 Asset management ratios - ability to Renerate and collect revenue from assets Receivables AR 3,582 4,427 4,787 832 818 $33 2.142 2,412 1,964 285 296 279 Net fixed assets FA 31,428 33,238 31,858 346 188 2,995 2,487 2.534 1,373 1,332 1.091 Total assets TA 92,358 91,900 103,065 4,337 3,767 3,109 45,516 48,574 50,796 3,936 4.405 Sales 4,216 Sales 52,708 55,870 55,355 5,299 5,506 3,881 24,866 26,487 25,281 2,442 2,454 2.307 Average daily sales ADS - Sale365 144.41 153.07 151.66 14.52 15.08 10.63 68.13 72.57 6925 6.69 6.72 632 Days sales outstanding DSOAR/ADS 2481 28.92 31.56 5731 54.23 50.13 31.44 33.24 28 36 42.67 4611 Days sales in inventory DSI INV/ADS 28 89 27.92 34,07 6089 45.41 63.76 19.11 20.09 21.54 41.20 43.03 45.65 Inventory turnover ratio ITR - Sales/INV 1263 13.08 10.71 5.99 8.04 5.72 19.10 18.17 1694 8.86 8.48 Fixed assets turnover ratio FATR-Sales/FA 8.00 1.68 1.68 1.74 15:32 18 23 8.30 10,65 9.98 1.78 1.84 2.12 Total asset turnover ratio TATR Sales/TA 0.57 0.61 0.54 1.22 146 1.25 0.55 0.55 0.50 0.62 0.56 0.55 Debt Rement ratios Total liabilities TL 34,102 35,123 41,083 3,973 3.580 3.521 9,429 9,408 19,382 1,428 1,976 1.926 EBITDA EBITDA 20,323 23,896 22,713 339 48 -314 8,247 8,700 6,990 796 667 537 COIT EBIT 12,291 15,347 14,002 103 -155 -481 7,230 7,550 5,776 588 422 237 Interest payments 1 244 192 337 177 177 160 23 5 104 16 27 33 Principal payments PP o 0 0 0 0 0 0 0 0 0 Lease payments LP 0 270 257 253 54 59 47 90 91 99 10 11 9 Debt ratio DRTUTA 0.37 0.38 0.40 0.92 0.95 1.13 0.21 0.19 0.38 0.36 0.45 0.46 Times interesteamed TIE-EBIT/ 50.37 29.93 41.55 0.58 -0.88 -3.01 314 35 1510.00 55 54 35.87 15 64 7.30 EBITDA coverage ratio ECR (EBITDA+LP/PP+LP) 39.54 53.79 38.93 1.41 0.45 -1.29 73.78 91 57 34.92 31.08 17.93 13.15 Profitability ratios Ni avalls NI 9.620 11,704 11.420 -83 -403 -660 6,853 7,967 5,271 455 355 Total common equity TCE 206 58.256 56,777 61,982 564 187 -412 36,088 39,16931,421 2. SOS 2,430 2,290 Profit margin PM-NI/Sales 0.18 0.21 0.21 0.02 0.07 -0.17 0.28 0.30 0.21 0.19 0.14 0,09 Basic earning power EBIT/TA 0.13 0.17 0.14 0.02 -0.04 0.15 0.16 016 0.11 0.15 0.10 0.06 EBITDA margin EBITDA/ Sales 0.39 0.43 0.41 0.06 0.01 0.08 0.33 0.33 0.28 0.33 0.27 0.23 Return on total assets ROANI/TA 0.10 0.13 0.11 -0.02 -0.11 0.21 0.15 0.16 0.10 0.12 0.08 0.05 Return on equity ROENI/ TCE 0.17 0.21 0.18 -0.15 2.16 1.60 0.19 0.20 0.17 0.18 0.15 0.09 Market value ratio Price 25.60 37.55 34.98 3.78 2.65 2.92 67.38 75.06 53.22 Price to earnings 27.78 33.91 34.75 13.69 16.36 14.97 N/A N/A N/A 17.01 16.25 13.85 17.69 Price-to-book 25.11 35.90 2.18 3.14 2.67 5.04 11.00 N/A 3.15 3.20 2.58 3.19 3.97 4.32 Duran PMNI/Sales 0.18 0.21 0.21 -0.07 -0.17 0.28 030 0.21 0.19 TATA 0.14 0.09 TATR Sales/TA 0.57 0.61 0.54 1.22 1.46 1.25 055 0.55 0.50 0.62 0 56 0.55 Equity multiplier EMTA/TCE 1.59 1.62 1.66 7.97 20.14 1.26 1.24 1.62 Return on equity 1.57 181 1.84 ROEPM'TATREM 0.17 0.21 0.18 -0.15 -2.16 1.60 0.19 0.20 0.17 0.18 0.15 0.09 Profit margin -0.02 -7.55 1 pts D Question 16 What is the measure of the ability to generate sales from total assets? Return on total assets Fixed assets turnover ratio Total asset turnover ratio Debt ratio D Question 17 1 pts Do you want this measure higher or lower? Higher Lower Question 18 1 pts Which company performed best by this measure in 2015? AMD O INTC O QCOM OMKIM