************** Please help if you could somehow do this i will definitely rate, Thank you ******************
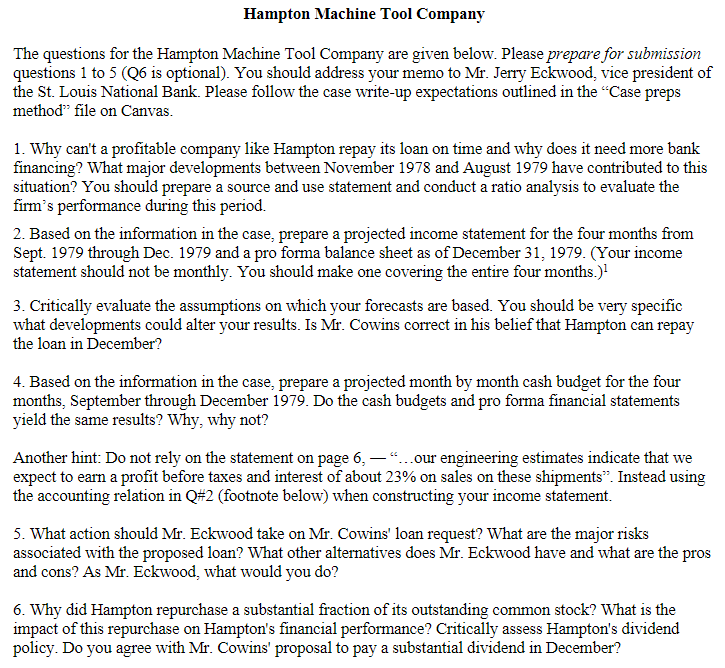
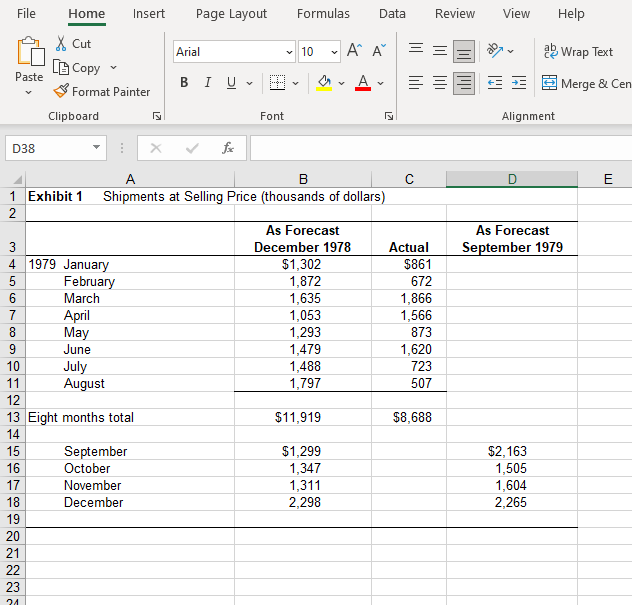
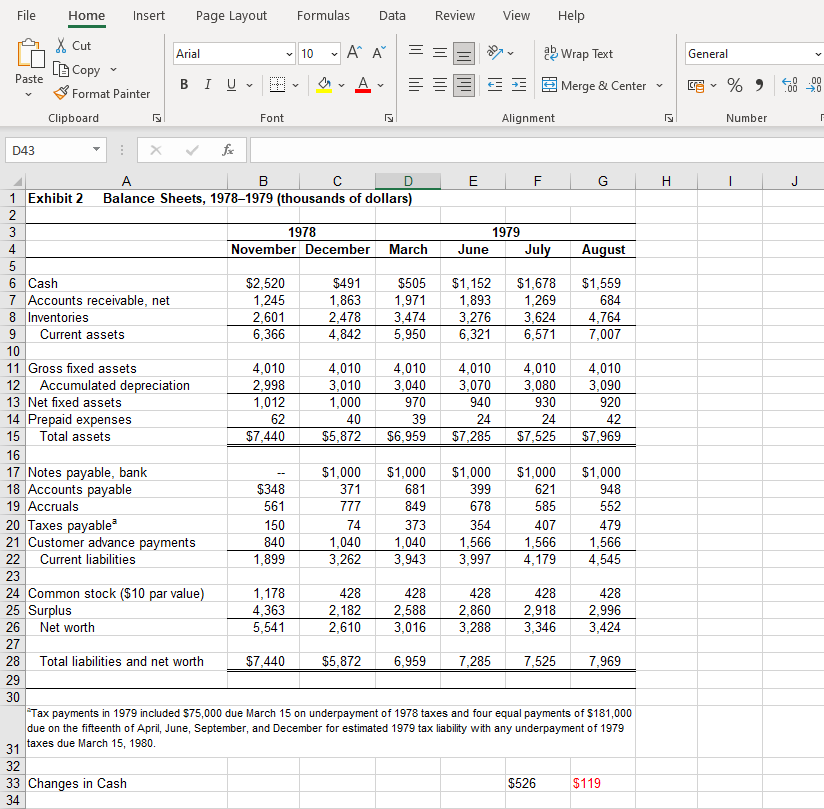
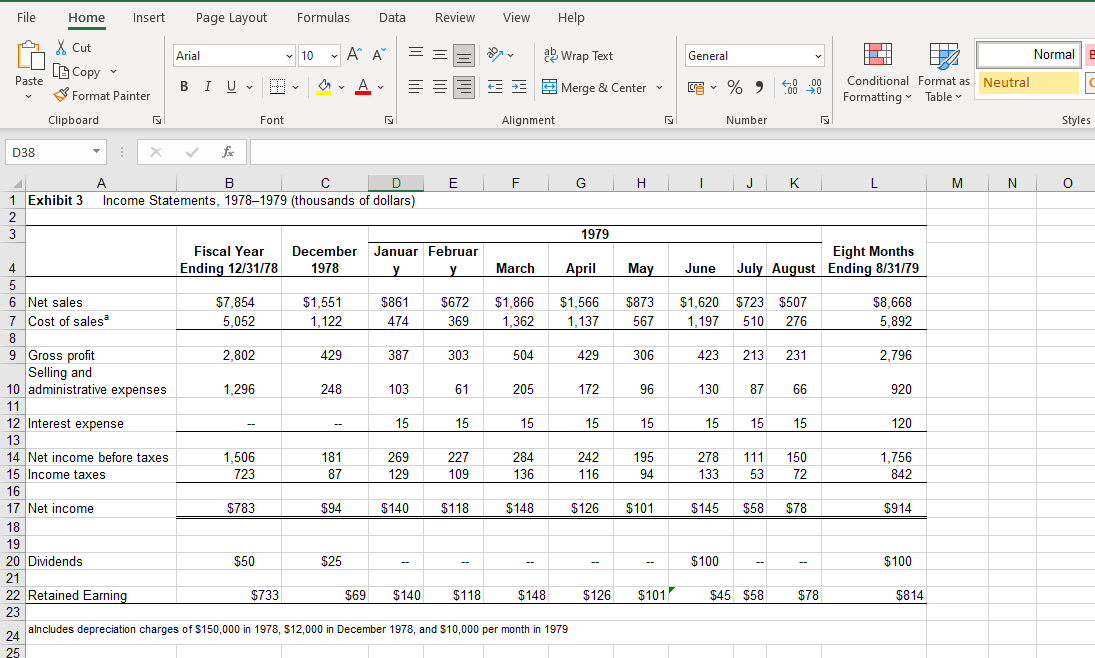
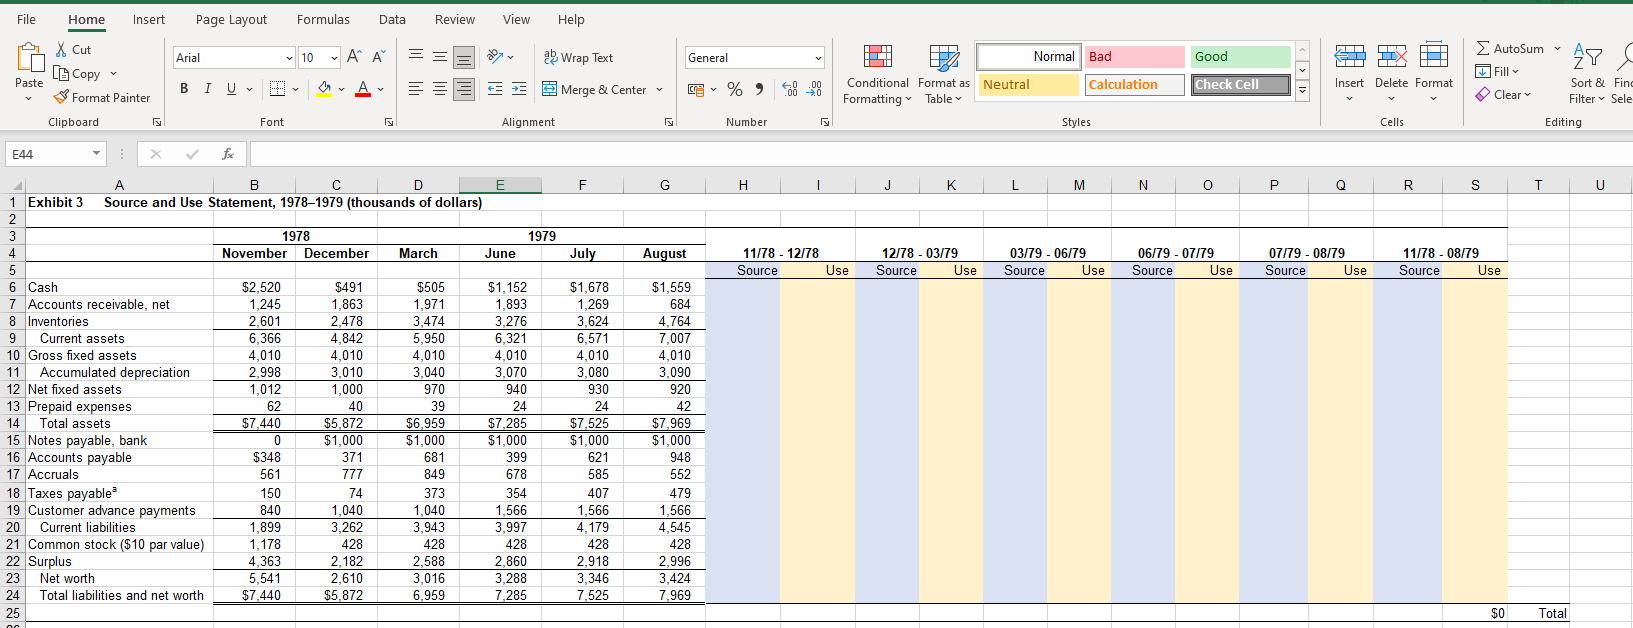
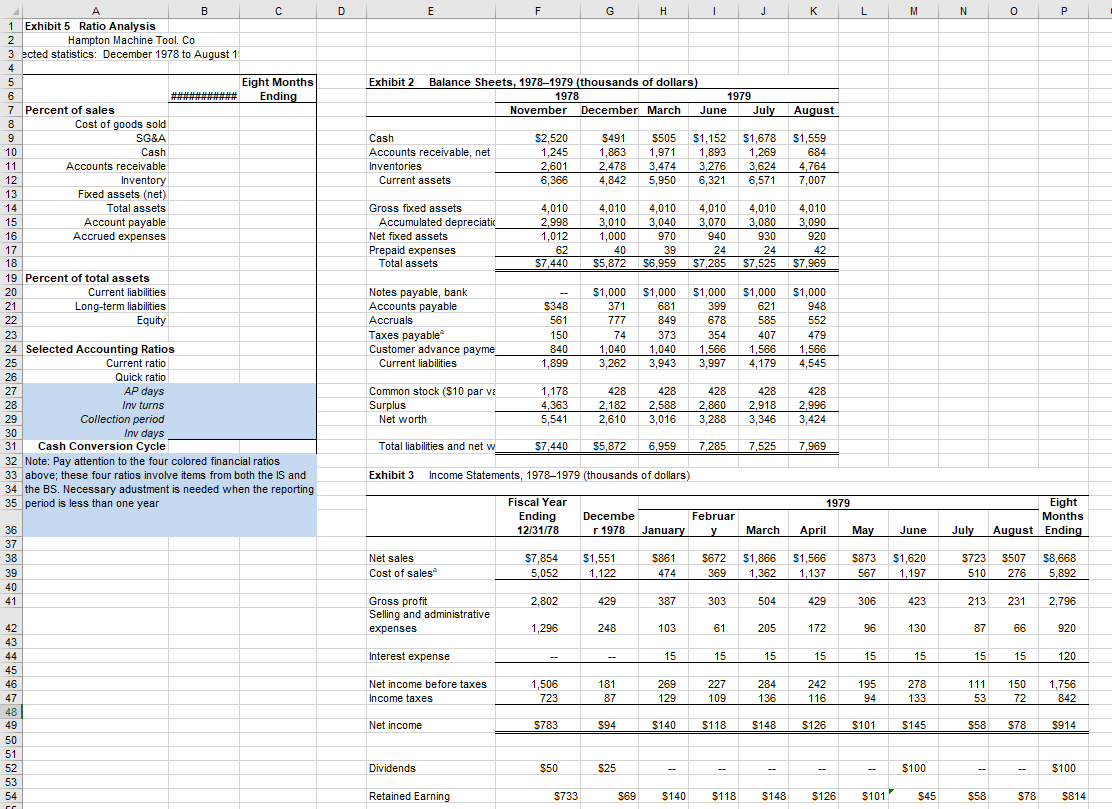
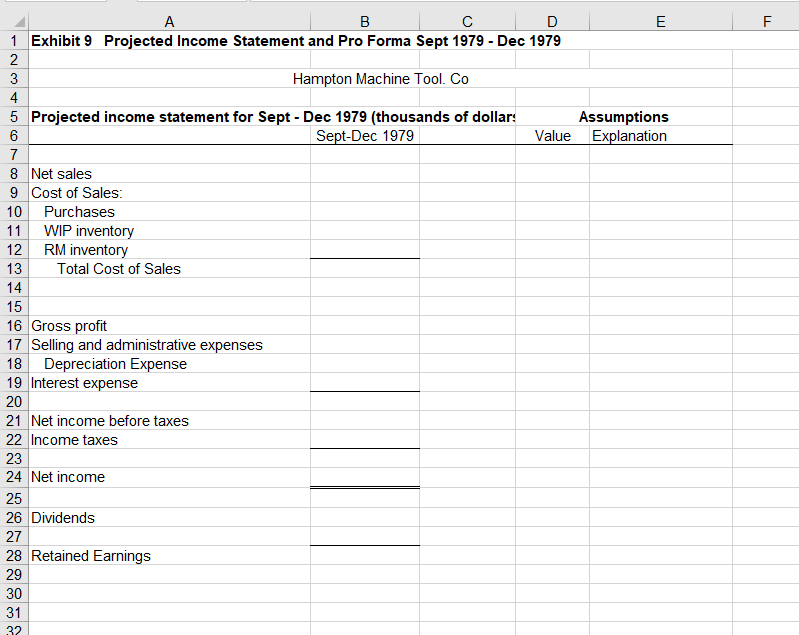
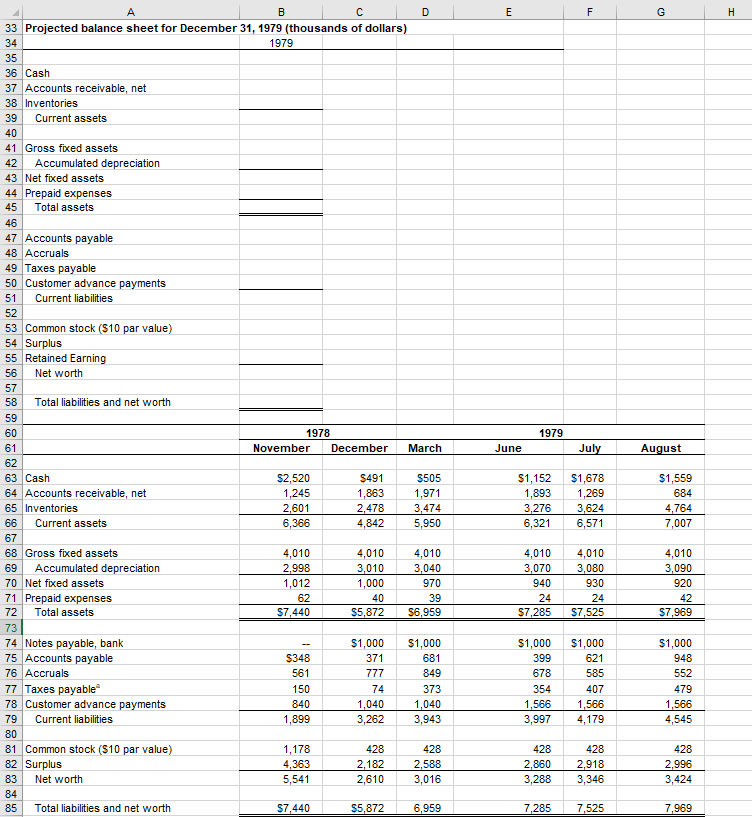
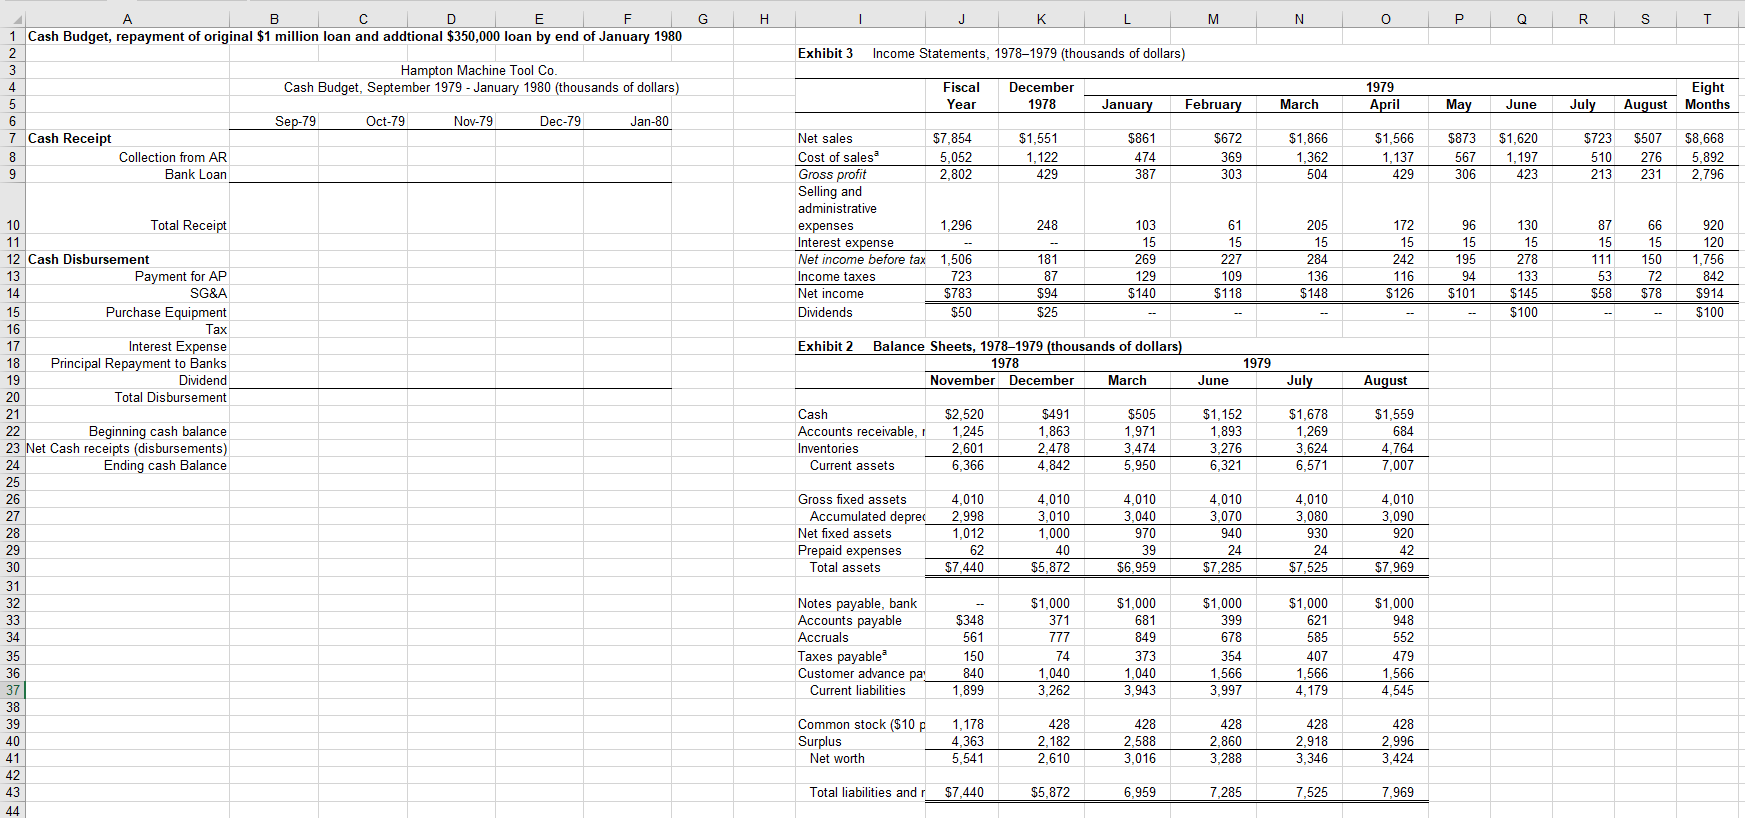
Hampton Machine Tool Company The questions for the Hampton Machine Tool Company are given below. Please prepare for submission questions 1 to 5 (Q6 is optional). You should address your memo to Mr. Jerry Eckwood, vice president of the St. Louis National Bank. Please follow the case write-up expectations outlined in the Case preps method file on Canvas 1. Why can't a profitable company like Hampton repay its loan on time and why does it need more bank financing? What major developments between November 1978 and August 1979 have contributed to this situation? You should prepare a source and use statement and conduct a ratio analysis to evaluate the firm's performance during this period. 2. Based on the information in the case, prepare a projected income statement for the four months from Sept. 1979 through Dec. 1979 and a pro forma balance sheet as of December 31, 1979. (Your income statement should not be monthly. You should make one covering the entire four months.) 3. Critically evaluate the assumptions on which your forecasts are based. You should be very specific what developments could alter your results. Is Mr. Cowins correct in his belief that Hampton can repay the loan in December? 4. Based on the information in the case, prepare a projected month by month cash budget for the four months, September through December 1979. Do the cash budgets and pro forma financial statements yield the same results? Why, why not? Another hint: Do not rely on the statement on page 6, ...our engineering estimates indicate that we expect to earn a profit before taxes and interest of about 23% on sales on these shipments. Instead using the accounting relation in Q#2 (footnote below) when constructing your income statement. 5. What action should Mr. Eckwood take on Mr. Cowins' loan request? What are the major risks associated with the proposed loan? What other alternatives does Mr. Eckwood have and what are the pros and cons? As Mr. Eckwood, what would you do? 6. Why did Hampton repurchase a substantial fraction of its outstanding common stock? What is the impact of this repurchase on Hampton's financial performance? Critically assess Hampton's dividend policy. Do you agree with Mr. Cowins' proposal to pay a substantial dividend in December? File Home Insert Page Layout Formulas Data Review View Help Arial 10 A A a Wrap Text Paste X Cut [G Copy Format Painter Clipboard Y y A EE E Merge & Cen Font Alignment D38 foc A B D E 1 Exhibit 1 2 Shipments at Selling Price (thousands of dollars) As Forecast September 1979 UND NOW As Forecast December 1978 $1,302 1,872 1,635 1,053 1,293 1,479 1,488 1,797 Actual $861 672 1,866 1,566 873 1,620 723 507 4 1979 January 5 February March April May June 10 July 11 August 12 13 Eight months total 14 15 September 16 October 17 November 18 December 19 20 21 22 23 $11,919 $8,688 $1,299 1,347 1,311 2,298 $2,163 1,505 1,604 2,265 24 File Home Insert Page Layout Formulas Data Review View Help Arial 10 Al Wrap Text General Y Paste X Cut [B Copy Format Painter Clipboard BIU y == = Merge & Center LE % 60 .00 000 2 Font Alignment Number D43 for H WN oo A B E F G 1 Exhibit 2 Balance Sheets, 19781979 (thousands of dollars) 2 3 1978 1979 4 November December March June July August 5 6 Cash $2,520 $491 $505 $1,152 $1,678 $1,559 7 Accounts receivable, net 1,245 1,863 1,971 1,893 1,269 684 8 Inventories 2,601 2,478 3,474 3,276 3,624 4,764 9 Current assets 6,366 4,842 5,950 6,321 6,571 7,007 10 11 Gross fixed assets 4,010 4,010 4,010 4,010 4,010 4,010 12 Accumulated depreciation 2,998 3,010 3,040 3,070 3,080 3,090 13 Net fixed assets 1,012 1,000 970 940 930 920 14 Prepaid expenses 62 40 39 24 24 42 15 Total assets $7,440 $5,872 $6,959 $7,285 $7,525 $7,969 16 17 Notes payable, bank $1,000 $1,000 $1,000 $1,000 $1,000 18 Accounts payable $348 371 681 399 621 948 19 Accruals 561 777 849 678 585 552 20 Taxes payable 150 74 373 354 407 479 21 Customer advance payments 840 1,040 1,040 1,566 1,566 1,566 22 Current liabilities 1,899 3,262 3,943 3,997 4,179 4,545 23 24 Common stock ($10 par value) 1,178 428 428 428 428 428 25 Surplus 4,363 2,182 2,588 2,860 2,918 2,996 26 Net worth 5,541 2,610 3,016 3,288 3,346 3,424 27 28 Total liabilities and net worth $7,440 $5,872 6,959 7,285 7,525 7,969 29 30 *Tax payments in 1979 included $75,000 due March 15 on underpayment of 1978 taxes and four equal payments of $181,000 due on the fifteenth of April, June, September, and December for estimated 1979 tax liability with any underpayment of 1979 31 taxes due March 15, 1980. 32 33 Changes in Cash $526 $119 34 File Home Insert Page Layout Formulas Data Review View Help 1 Arial 10 AA == ce Wrap Text General X Cut LECopy * Format Painter Paste BIU y y E- Merge & Center C%) 28 14 D Normal E Conditional Format as Neutral Formatting Table Styles Clipboard Font Alignment Number D38 X for . 1 J K L M N 0 May June Eight Months July August Ending 8/31/79 $873 567 $1,620 1,197 $723 $507 510 276 $8,668 5,892 306 423 213 231 2.796 96 130 87 66 920 A B D D E F G 1 Exhibit 3 Income Statements, 1978-1979 (thousands of dollars) 2 3 1979 Fiscal Year December Januar Februar 4 Ending 12/31/78 1978 y March April 5 6 Net sales $7,854 $1,551 $861 $672 $1,866 $1,566 7 Cost of sales 5,052 1,122 474 369 1,362 1,137 8 9 Gross profit 2.802 429 387 303 504 429 Selling and 10 administrative expenses 1.296 248 103 61 205 172 11 12 Interest expense 15 15 15 15 13 14 Net income before taxes 1,506 181 269 227 284 242 15 Income taxes 723 87 129 109 136 116 16 17 Net income $783 $94 $140 $118 $148 $126 18 19 20 Dividends $50 $25 21 22 Retained Earning $733 $69 $140 $118 $148 $126 23 24 alncludes depreciation charges of $150,000 in 1978, 512,000 in December 1978, and $10,000 per month in 1979 25 15 15 15 15 120 195 94 278 133 111 53 150 72 1,756 842 $101 $145 $58 $78 $914 $100 $100 $101 $45 $58 $78 $814 File Home Insert Page Layout Formulas Data Review View Help Arial A A A == 10 HE HA PH ab Wrap Text Normal Bad AutoSum General Good LV LA X Cut LECopy Format Painter WE 28 Fill Paste a-A- E E Merge & Center Insert Delete Format Calculation CE%, 8. Check Cell .00 0 Conditional Format as Neutral Formatting Table Clear Sort & Find Filter Sele Clipboard Font Alignment Number Styles Cells Editing E44 for F G H 1 J K L M M N 0 Q Q R S T T U July August 11/78 - 12/78 Source 12/78 - 03/79 Source Use 03/79 - 06/79 Source Use 06/79 - 07/79 Source Use 07/79 - 08/79 Source Use 11/78 - 08/79 Source Use Use A B D E 1 Exhibit 3 Source and Use Statement, 19781979 (thousands of dollars) 2 3 3 1978 1979 4 November December March June 5 6 Cash $2,520 $491 $505 $1,152 7 Accounts receivable, net 1,245 1,863 1,971 1,893 8 Inventories 2,601 2,478 3,474 3,276 9 Current assets 6,366 4,842 5,950 6,321 10 Gross fixed assets 4.010 4,010 4,010 4,010 11 Accumulated depreciation 2.998 3,010 3,040 3,070 12 Net fixed assets 1,012 1,000 970 940 13 Prepaid expenses 62 40 39 24 14 Total assets $7.440 $5,872 $6,959 $7,285 15 Notes payable, bank 0 $1,000 $1,000 $1,000 16 Accounts payable $348 371 681 399 17 Accruals 561 777 849 678 18 Taxes payable 150 74 373 354 19 Customer advance payments 840 1,040 1,040 1,566 20 Current liabilities 1,899 3.262 3,943 3,997 21 Common stock ($10 par value) 1,178 428 428 428 22 Surplus 4,363 2,182 2,588 2,860 23 Net worth 5.541 2,610 3,016 3,288 24 Total liabilities and net worth $7,440 $5,872 6.959 7,285 25 $1,678 1.269 3,624 6,571 4,010 3,080 930 24 $7.525 $1,000 621 585 407 1,566 4.179 428 2.918 3,346 7,525 $1,559 684 4,764 7,007 4,010 3,090 920 42 $7,969 $1,000 948 552 479 1.566 4,545 428 2.996 3,424 7,969 $0 Total D E F G H 1 J L M M N 0 P Exhibit 2 Balance Sheets, 1978-1979 (thousands of dollars) 1978 1979 November December March June July August Cash Accounts receivable, net Inventories Current assets $2,520 1,245 2,601 6,366 $491 1,863 2,478 4,842 $505 1,971 3,474 5,950 $1,152 1,893 3,276 6,321 $1,678 1,269 3,624 6,571 $1,559 684 4,764 7,007 B 1 Exhibit 5 Ratio Analysis 2 Hampton Machine Tool. Co 3 ected statistics: December 1978 to August 1 4 5 Eight Months 6 Ending 7 Percent of sales 8 Cost of goods sold 9 9 SG&A 10 Cash 11 Accounts receivable 12 Inventory 13 Fixed assets (net) 14 Total assets 15 Account payable 16 Accrued expenses 17 18 19 Percent of total assets 20 Current liabilities 21 Long-term liabilities 22 Equity 23 24 Selected Accounting Ratios 25 Current ratio 26 Quick ratio 27 28 Inv turns 29 Collection period 30 Inv days 31 Cash Conversion Cycle 32 Note: Pay attention to the four colored financial ratios 33 above; these four ratios involve items from both the IS and 34 the BS. Necessary adustment is needed when the reporting 35 period is less than one year Gross fixed assets Accumulated depreciatic Net fixed assets Prepaid expenses Total assets 4,010 2.998 1,012 62 $7,440 4,010 3,010 1,000 40 $5,872 4,010 3,040 970 39 $6,959 4,010 3,070 940 24 $7,285 4,010 3,080 930 24 $7,525 4,010 3,090 920 42 $7,969 Notes payable, bank Accounts payable Accruals Taxes payable Customer advance payme Current liabilities $348 561 150 840 1,899 $1,000 371 777 74 1,040 3,262 $1,000 681 849 373 1,040 3,943 $1,000 399 678 354 1,566 3,997 $1,000 621 585 407 1.566 4,179 $1,000 948 552 479 1.566 4,545 AP days Common stock ($10 par va Surplus Net worth 1,178 4,363 5,541 428 2,182 2,610 428 2,588 3,016 428 2,860 3,288 428 2,918 3,346 428 2.996 3,424 Total liabilities and net w $7,440 $5,872 6,959 7,285 7,525 7,969 Exhibit 3 Income Statements, 19781979 (thousands of dollars) 1979 Fiscal Year Ending 12/31/78 Decembe r 1978 Eight Months August Ending Februar y January March April May June July 36 37 38 39 40 41 Net sales Cost of sales $7,854 5,052 $1,551 1,122 $861 474 $672 369 $1,866 1,362 $1,566 1,137 $873 567 $1,620 1,197 $723 510 $507 276 $8,668 5,892 2,802 429 387 303 504 429 306 423 213 231 2,796 Gross profit Selling and administrative expenses 1,296 248 103 61 205 172 96 130 87 66 920 Interest expense 15 15 15 15 15 15 15 15 120 1,506 Net income before taxes Income taxes 181 87 269 129 227 109 284 136 242 116 195 94 278 133 111 53 150 72 1,756 842 723 42 43 44 45 46 47 48 | 49 50 51 52 53 54 Net income $783 $94 $140 $ $118 $148 $126 $ $101 $145 $58 $78 $914 Dividends $50 $25 $100 $100 Retained Earning $733 $69 $140 $118 $148 $126 $1017 $45 $58 $78 $814 F WN B D E 1 Exhibit 9 Projected Income Statement and Pro Forma Sept 1979 - Dec 1979 2 3 Hampton Machine Tool. Co 4 5 Projected income statement for Sept - Dec 1979 (thousands of dollar: Assumptions 6 Sept-Dec 1979 Value Explanation 7 8 Net sales 9 Cost of Sales: 10 Purchases 11 WIP inventory 12 RM inventory 13 Total Cost of Sales 14 15 16 Gross profit 17 Selling and administrative expenses 18 Depreciation Expense 19 Interest expense 20 21 Net income before taxes 22 Income taxes 23 24 Net income 25 26 Dividends 27 28 Retained Earnings 29 30 31 32 E F F G H A B D 33 Projected balance sheet for December 31, 1979 (thousands of dollars) 34 1979 35 36 Cash 37 Accounts receivable, net 38 Inventories 39 Current assets 40 41 Gross fixed assets 42 Accumulated depreciation 43 Net fixed assets 44 Prepaid expenses 45 Total assets 46 47 Accounts payable 48 Accruals 49 Taxes payable 50 Customer advance payments 51 Current liabilities 52 53 Common stock ($10 par value) 54 Surplus 55 Retained Earning 56 Net worth 57 58 Total liabilities and net worth 59 60 1978 61 November December March 62 63 Cash $2,520 $491 $505 64 Accounts receivable, net 1,245 1,863 1,971 65 Inventories 2,601 2.478 3,474 66 Current assets 6,366 4,842 5,950 67 68 Gross fixed assets 4,010 4,010 4,010 69 Accumulated depreciation 2,998 3,010 3,040 70 Net fixed assets 1,012 1,000 970 71 Prepaid expenses 62 40 39 72 Total assets $7,440 $5,872 $6,959 73 74 Notes payable, bank $1,000 $1,000 75 Accounts payable $348 371 681 76 Accruals 561 777 849 77 Taxes payable 150 74 373 78 Customer advance payments 840 1,040 1,040 79 Current liabilities 1,899 3,262 3,943 80 81 Common stock (510 par value) 1,178 428 428 82 Surplus 4,363 2,182 2,588 83 Net worth 5,541 2,610 3,016 84 85 Total liabilities and net worth $7,440 $5,872 6,959 1979 June July August $1,152 1,893 3,276 6,321 $1,678 1,269 3,624 6,571 $1,559 684 4,764 7,007 4,010 3,070 940 24 $7,285 4,010 3,080 930 24 $7,525 4,010 3,090 920 42 $7.969 $1,000 399 678 354 1,566 3,997 $1,000 621 585 407 1,566 4,179 $1,000 948 552 479 1,566 4,545 428 2,860 3,288 428 2,918 3,346 428 2,996 3,424 7,285 7,525 7,969 G . H J K M N 0 P Q R S T Exhibit 3 Income Statements, 19781979 (thousands of dollars) A B C D D E | F 1 Cash Budget, repayment of original $1 million loan and addtional $350,000 loan by end of January 1980 2 3 Hampton Machine Tool Co. 4 Cash Budget, September 1979 - January 1980 (thousands of dollars) 5 6 Sep-79 Oct-79 Nov-79 Dec-79 Jan-80 7 Cash Receipt 8 Collection from AR 9 Bank Loan Fiscal Year December 1978 January February March 1979 April May June Eight August Months July $1,551 1.122 429 $861 474 387 $672 369 303 $1,866 1,362 504 $1,566 1.137 429 $873 567 306 $1,620 1,197 423 $723 510 213 $507 276 231 $8.668 5,892 2.796 Net sales $7,854 Cost of salesa 5,052 Gross profit 2,802 Selling and administrative expenses 1,296 Interest expense Net income before tax 1,506 Income taxes 723 Net income $783 Dividends $50 248 181 87 $94 $25 103 15 269 129 $140 61 15 227 109 $118 205 15 284 136 $148 172 15 242 116 $126 96 15 195 94 $101 130 15 278 133 $145 $100 87 15 111 53 $58 66 15 150 72 $78 920 120 1,756 842 $914 $100 Exhibit 2 Balance Sheets, 19781979 (thousands of dollars) 1978 November December March 1979 June July August Cash Accounts receivable, Inventories Current assets $2,520 1,245 2,601 6,366 $491 1,863 2.478 4,842 $505 1,971 3,474 5,950 $1,152 1,893 3,276 6,321 $1,678 1,269 3,624 6,571 $1,559 684 4,764 7,007 10 Total Receipt 11 12 Cash Disbursement 13 Payment for AP 14 SG&A 15 Purchase Equipment 16 Tax 17 Interest Expense 18 Principal Repayment to Banks 19 Dividend 20 Total Disbursement 21 22 Beginning cash balance 23 Net Cash receipts (disbursements) 24 Ending cash Balance 25 26 27 28 29 30 31 32 33 34 35 36 37 38 39 40 41 42 43 44 Gross fixed assets Accumulated deprec Net fixed assets Prepaid expenses Total assets 4,010 2,998 1,012 62 $7,440 4,010 3,010 1,000 40 $5,872 4.010 3,040 970 39 $6,959 4,010 3.070 940 24 $7,285 4,010 3,080 930 24 $7,525 4.010 3,090 920 42 $7,969 Notes payable, bank Accounts payable Accruals Taxes payable Customer advance pay Current liabilities $348 561 150 840 1,899 $1,000 371 777 74 1,040 3.262 $1,000 681 849 373 1,040 3,943 $1,000 399 678 354 1,566 3,997 $1,000 621 585 407 1,566 4.179 $1,000 948 552 479 1,566 4,545 Common stock ($10 p Surplus Net worth 1,178 4.363 5,541 428 2,182 2,610 428 2,588 3,016 428 2,860 3,288 428 2,918 3,346 428 2,996 3,424 Total liabilities and r $7,440 $5,872 6,959 7,285 7,525 7,969 Hampton Machine Tool Company The questions for the Hampton Machine Tool Company are given below. Please prepare for submission questions 1 to 5 (Q6 is optional). You should address your memo to Mr. Jerry Eckwood, vice president of the St. Louis National Bank. Please follow the case write-up expectations outlined in the Case preps method file on Canvas 1. Why can't a profitable company like Hampton repay its loan on time and why does it need more bank financing? What major developments between November 1978 and August 1979 have contributed to this situation? You should prepare a source and use statement and conduct a ratio analysis to evaluate the firm's performance during this period. 2. Based on the information in the case, prepare a projected income statement for the four months from Sept. 1979 through Dec. 1979 and a pro forma balance sheet as of December 31, 1979. (Your income statement should not be monthly. You should make one covering the entire four months.) 3. Critically evaluate the assumptions on which your forecasts are based. You should be very specific what developments could alter your results. Is Mr. Cowins correct in his belief that Hampton can repay the loan in December? 4. Based on the information in the case, prepare a projected month by month cash budget for the four months, September through December 1979. Do the cash budgets and pro forma financial statements yield the same results? Why, why not? Another hint: Do not rely on the statement on page 6, ...our engineering estimates indicate that we expect to earn a profit before taxes and interest of about 23% on sales on these shipments. Instead using the accounting relation in Q#2 (footnote below) when constructing your income statement. 5. What action should Mr. Eckwood take on Mr. Cowins' loan request? What are the major risks associated with the proposed loan? What other alternatives does Mr. Eckwood have and what are the pros and cons? As Mr. Eckwood, what would you do? 6. Why did Hampton repurchase a substantial fraction of its outstanding common stock? What is the impact of this repurchase on Hampton's financial performance? Critically assess Hampton's dividend policy. Do you agree with Mr. Cowins' proposal to pay a substantial dividend in December? File Home Insert Page Layout Formulas Data Review View Help Arial 10 A A a Wrap Text Paste X Cut [G Copy Format Painter Clipboard Y y A EE E Merge & Cen Font Alignment D38 foc A B D E 1 Exhibit 1 2 Shipments at Selling Price (thousands of dollars) As Forecast September 1979 UND NOW As Forecast December 1978 $1,302 1,872 1,635 1,053 1,293 1,479 1,488 1,797 Actual $861 672 1,866 1,566 873 1,620 723 507 4 1979 January 5 February March April May June 10 July 11 August 12 13 Eight months total 14 15 September 16 October 17 November 18 December 19 20 21 22 23 $11,919 $8,688 $1,299 1,347 1,311 2,298 $2,163 1,505 1,604 2,265 24 File Home Insert Page Layout Formulas Data Review View Help Arial 10 Al Wrap Text General Y Paste X Cut [B Copy Format Painter Clipboard BIU y == = Merge & Center LE % 60 .00 000 2 Font Alignment Number D43 for H WN oo A B E F G 1 Exhibit 2 Balance Sheets, 19781979 (thousands of dollars) 2 3 1978 1979 4 November December March June July August 5 6 Cash $2,520 $491 $505 $1,152 $1,678 $1,559 7 Accounts receivable, net 1,245 1,863 1,971 1,893 1,269 684 8 Inventories 2,601 2,478 3,474 3,276 3,624 4,764 9 Current assets 6,366 4,842 5,950 6,321 6,571 7,007 10 11 Gross fixed assets 4,010 4,010 4,010 4,010 4,010 4,010 12 Accumulated depreciation 2,998 3,010 3,040 3,070 3,080 3,090 13 Net fixed assets 1,012 1,000 970 940 930 920 14 Prepaid expenses 62 40 39 24 24 42 15 Total assets $7,440 $5,872 $6,959 $7,285 $7,525 $7,969 16 17 Notes payable, bank $1,000 $1,000 $1,000 $1,000 $1,000 18 Accounts payable $348 371 681 399 621 948 19 Accruals 561 777 849 678 585 552 20 Taxes payable 150 74 373 354 407 479 21 Customer advance payments 840 1,040 1,040 1,566 1,566 1,566 22 Current liabilities 1,899 3,262 3,943 3,997 4,179 4,545 23 24 Common stock ($10 par value) 1,178 428 428 428 428 428 25 Surplus 4,363 2,182 2,588 2,860 2,918 2,996 26 Net worth 5,541 2,610 3,016 3,288 3,346 3,424 27 28 Total liabilities and net worth $7,440 $5,872 6,959 7,285 7,525 7,969 29 30 *Tax payments in 1979 included $75,000 due March 15 on underpayment of 1978 taxes and four equal payments of $181,000 due on the fifteenth of April, June, September, and December for estimated 1979 tax liability with any underpayment of 1979 31 taxes due March 15, 1980. 32 33 Changes in Cash $526 $119 34 File Home Insert Page Layout Formulas Data Review View Help 1 Arial 10 AA == ce Wrap Text General X Cut LECopy * Format Painter Paste BIU y y E- Merge & Center C%) 28 14 D Normal E Conditional Format as Neutral Formatting Table Styles Clipboard Font Alignment Number D38 X for . 1 J K L M N 0 May June Eight Months July August Ending 8/31/79 $873 567 $1,620 1,197 $723 $507 510 276 $8,668 5,892 306 423 213 231 2.796 96 130 87 66 920 A B D D E F G 1 Exhibit 3 Income Statements, 1978-1979 (thousands of dollars) 2 3 1979 Fiscal Year December Januar Februar 4 Ending 12/31/78 1978 y March April 5 6 Net sales $7,854 $1,551 $861 $672 $1,866 $1,566 7 Cost of sales 5,052 1,122 474 369 1,362 1,137 8 9 Gross profit 2.802 429 387 303 504 429 Selling and 10 administrative expenses 1.296 248 103 61 205 172 11 12 Interest expense 15 15 15 15 13 14 Net income before taxes 1,506 181 269 227 284 242 15 Income taxes 723 87 129 109 136 116 16 17 Net income $783 $94 $140 $118 $148 $126 18 19 20 Dividends $50 $25 21 22 Retained Earning $733 $69 $140 $118 $148 $126 23 24 alncludes depreciation charges of $150,000 in 1978, 512,000 in December 1978, and $10,000 per month in 1979 25 15 15 15 15 120 195 94 278 133 111 53 150 72 1,756 842 $101 $145 $58 $78 $914 $100 $100 $101 $45 $58 $78 $814 File Home Insert Page Layout Formulas Data Review View Help Arial A A A == 10 HE HA PH ab Wrap Text Normal Bad AutoSum General Good LV LA X Cut LECopy Format Painter WE 28 Fill Paste a-A- E E Merge & Center Insert Delete Format Calculation CE%, 8. Check Cell .00 0 Conditional Format as Neutral Formatting Table Clear Sort & Find Filter Sele Clipboard Font Alignment Number Styles Cells Editing E44 for F G H 1 J K L M M N 0 Q Q R S T T U July August 11/78 - 12/78 Source 12/78 - 03/79 Source Use 03/79 - 06/79 Source Use 06/79 - 07/79 Source Use 07/79 - 08/79 Source Use 11/78 - 08/79 Source Use Use A B D E 1 Exhibit 3 Source and Use Statement, 19781979 (thousands of dollars) 2 3 3 1978 1979 4 November December March June 5 6 Cash $2,520 $491 $505 $1,152 7 Accounts receivable, net 1,245 1,863 1,971 1,893 8 Inventories 2,601 2,478 3,474 3,276 9 Current assets 6,366 4,842 5,950 6,321 10 Gross fixed assets 4.010 4,010 4,010 4,010 11 Accumulated depreciation 2.998 3,010 3,040 3,070 12 Net fixed assets 1,012 1,000 970 940 13 Prepaid expenses 62 40 39 24 14 Total assets $7.440 $5,872 $6,959 $7,285 15 Notes payable, bank 0 $1,000 $1,000 $1,000 16 Accounts payable $348 371 681 399 17 Accruals 561 777 849 678 18 Taxes payable 150 74 373 354 19 Customer advance payments 840 1,040 1,040 1,566 20 Current liabilities 1,899 3.262 3,943 3,997 21 Common stock ($10 par value) 1,178 428 428 428 22 Surplus 4,363 2,182 2,588 2,860 23 Net worth 5.541 2,610 3,016 3,288 24 Total liabilities and net worth $7,440 $5,872 6.959 7,285 25 $1,678 1.269 3,624 6,571 4,010 3,080 930 24 $7.525 $1,000 621 585 407 1,566 4.179 428 2.918 3,346 7,525 $1,559 684 4,764 7,007 4,010 3,090 920 42 $7,969 $1,000 948 552 479 1.566 4,545 428 2.996 3,424 7,969 $0 Total D E F G H 1 J L M M N 0 P Exhibit 2 Balance Sheets, 1978-1979 (thousands of dollars) 1978 1979 November December March June July August Cash Accounts receivable, net Inventories Current assets $2,520 1,245 2,601 6,366 $491 1,863 2,478 4,842 $505 1,971 3,474 5,950 $1,152 1,893 3,276 6,321 $1,678 1,269 3,624 6,571 $1,559 684 4,764 7,007 B 1 Exhibit 5 Ratio Analysis 2 Hampton Machine Tool. Co 3 ected statistics: December 1978 to August 1 4 5 Eight Months 6 Ending 7 Percent of sales 8 Cost of goods sold 9 9 SG&A 10 Cash 11 Accounts receivable 12 Inventory 13 Fixed assets (net) 14 Total assets 15 Account payable 16 Accrued expenses 17 18 19 Percent of total assets 20 Current liabilities 21 Long-term liabilities 22 Equity 23 24 Selected Accounting Ratios 25 Current ratio 26 Quick ratio 27 28 Inv turns 29 Collection period 30 Inv days 31 Cash Conversion Cycle 32 Note: Pay attention to the four colored financial ratios 33 above; these four ratios involve items from both the IS and 34 the BS. Necessary adustment is needed when the reporting 35 period is less than one year Gross fixed assets Accumulated depreciatic Net fixed assets Prepaid expenses Total assets 4,010 2.998 1,012 62 $7,440 4,010 3,010 1,000 40 $5,872 4,010 3,040 970 39 $6,959 4,010 3,070 940 24 $7,285 4,010 3,080 930 24 $7,525 4,010 3,090 920 42 $7,969 Notes payable, bank Accounts payable Accruals Taxes payable Customer advance payme Current liabilities $348 561 150 840 1,899 $1,000 371 777 74 1,040 3,262 $1,000 681 849 373 1,040 3,943 $1,000 399 678 354 1,566 3,997 $1,000 621 585 407 1.566 4,179 $1,000 948 552 479 1.566 4,545 AP days Common stock ($10 par va Surplus Net worth 1,178 4,363 5,541 428 2,182 2,610 428 2,588 3,016 428 2,860 3,288 428 2,918 3,346 428 2.996 3,424 Total liabilities and net w $7,440 $5,872 6,959 7,285 7,525 7,969 Exhibit 3 Income Statements, 19781979 (thousands of dollars) 1979 Fiscal Year Ending 12/31/78 Decembe r 1978 Eight Months August Ending Februar y January March April May June July 36 37 38 39 40 41 Net sales Cost of sales $7,854 5,052 $1,551 1,122 $861 474 $672 369 $1,866 1,362 $1,566 1,137 $873 567 $1,620 1,197 $723 510 $507 276 $8,668 5,892 2,802 429 387 303 504 429 306 423 213 231 2,796 Gross profit Selling and administrative expenses 1,296 248 103 61 205 172 96 130 87 66 920 Interest expense 15 15 15 15 15 15 15 15 120 1,506 Net income before taxes Income taxes 181 87 269 129 227 109 284 136 242 116 195 94 278 133 111 53 150 72 1,756 842 723 42 43 44 45 46 47 48 | 49 50 51 52 53 54 Net income $783 $94 $140 $ $118 $148 $126 $ $101 $145 $58 $78 $914 Dividends $50 $25 $100 $100 Retained Earning $733 $69 $140 $118 $148 $126 $1017 $45 $58 $78 $814 F WN B D E 1 Exhibit 9 Projected Income Statement and Pro Forma Sept 1979 - Dec 1979 2 3 Hampton Machine Tool. Co 4 5 Projected income statement for Sept - Dec 1979 (thousands of dollar: Assumptions 6 Sept-Dec 1979 Value Explanation 7 8 Net sales 9 Cost of Sales: 10 Purchases 11 WIP inventory 12 RM inventory 13 Total Cost of Sales 14 15 16 Gross profit 17 Selling and administrative expenses 18 Depreciation Expense 19 Interest expense 20 21 Net income before taxes 22 Income taxes 23 24 Net income 25 26 Dividends 27 28 Retained Earnings 29 30 31 32 E F F G H A B D 33 Projected balance sheet for December 31, 1979 (thousands of dollars) 34 1979 35 36 Cash 37 Accounts receivable, net 38 Inventories 39 Current assets 40 41 Gross fixed assets 42 Accumulated depreciation 43 Net fixed assets 44 Prepaid expenses 45 Total assets 46 47 Accounts payable 48 Accruals 49 Taxes payable 50 Customer advance payments 51 Current liabilities 52 53 Common stock ($10 par value) 54 Surplus 55 Retained Earning 56 Net worth 57 58 Total liabilities and net worth 59 60 1978 61 November December March 62 63 Cash $2,520 $491 $505 64 Accounts receivable, net 1,245 1,863 1,971 65 Inventories 2,601 2.478 3,474 66 Current assets 6,366 4,842 5,950 67 68 Gross fixed assets 4,010 4,010 4,010 69 Accumulated depreciation 2,998 3,010 3,040 70 Net fixed assets 1,012 1,000 970 71 Prepaid expenses 62 40 39 72 Total assets $7,440 $5,872 $6,959 73 74 Notes payable, bank $1,000 $1,000 75 Accounts payable $348 371 681 76 Accruals 561 777 849 77 Taxes payable 150 74 373 78 Customer advance payments 840 1,040 1,040 79 Current liabilities 1,899 3,262 3,943 80 81 Common stock (510 par value) 1,178 428 428 82 Surplus 4,363 2,182 2,588 83 Net worth 5,541 2,610 3,016 84 85 Total liabilities and net worth $7,440 $5,872 6,959 1979 June July August $1,152 1,893 3,276 6,321 $1,678 1,269 3,624 6,571 $1,559 684 4,764 7,007 4,010 3,070 940 24 $7,285 4,010 3,080 930 24 $7,525 4,010 3,090 920 42 $7.969 $1,000 399 678 354 1,566 3,997 $1,000 621 585 407 1,566 4,179 $1,000 948 552 479 1,566 4,545 428 2,860 3,288 428 2,918 3,346 428 2,996 3,424 7,285 7,525 7,969 G . H J K M N 0 P Q R S T Exhibit 3 Income Statements, 19781979 (thousands of dollars) A B C D D E | F 1 Cash Budget, repayment of original $1 million loan and addtional $350,000 loan by end of January 1980 2 3 Hampton Machine Tool Co. 4 Cash Budget, September 1979 - January 1980 (thousands of dollars) 5 6 Sep-79 Oct-79 Nov-79 Dec-79 Jan-80 7 Cash Receipt 8 Collection from AR 9 Bank Loan Fiscal Year December 1978 January February March 1979 April May June Eight August Months July $1,551 1.122 429 $861 474 387 $672 369 303 $1,866 1,362 504 $1,566 1.137 429 $873 567 306 $1,620 1,197 423 $723 510 213 $507 276 231 $8.668 5,892 2.796 Net sales $7,854 Cost of salesa 5,052 Gross profit 2,802 Selling and administrative expenses 1,296 Interest expense Net income before tax 1,506 Income taxes 723 Net income $783 Dividends $50 248 181 87 $94 $25 103 15 269 129 $140 61 15 227 109 $118 205 15 284 136 $148 172 15 242 116 $126 96 15 195 94 $101 130 15 278 133 $145 $100 87 15 111 53 $58 66 15 150 72 $78 920 120 1,756 842 $914 $100 Exhibit 2 Balance Sheets, 19781979 (thousands of dollars) 1978 November December March 1979 June July August Cash Accounts receivable, Inventories Current assets $2,520 1,245 2,601 6,366 $491 1,863 2.478 4,842 $505 1,971 3,474 5,950 $1,152 1,893 3,276 6,321 $1,678 1,269 3,624 6,571 $1,559 684 4,764 7,007 10 Total Receipt 11 12 Cash Disbursement 13 Payment for AP 14 SG&A 15 Purchase Equipment 16 Tax 17 Interest Expense 18 Principal Repayment to Banks 19 Dividend 20 Total Disbursement 21 22 Beginning cash balance 23 Net Cash receipts (disbursements) 24 Ending cash Balance 25 26 27 28 29 30 31 32 33 34 35 36 37 38 39 40 41 42 43 44 Gross fixed assets Accumulated deprec Net fixed assets Prepaid expenses Total assets 4,010 2,998 1,012 62 $7,440 4,010 3,010 1,000 40 $5,872 4.010 3,040 970 39 $6,959 4,010 3.070 940 24 $7,285 4,010 3,080 930 24 $7,525 4.010 3,090 920 42 $7,969 Notes payable, bank Accounts payable Accruals Taxes payable Customer advance pay Current liabilities $348 561 150 840 1,899 $1,000 371 777 74 1,040 3.262 $1,000 681 849 373 1,040 3,943 $1,000 399 678 354 1,566 3,997 $1,000 621 585 407 1,566 4.179 $1,000 948 552 479 1,566 4,545 Common stock ($10 p Surplus Net worth 1,178 4.363 5,541 428 2,182 2,610 428 2,588 3,016 428 2,860 3,288 428 2,918 3,346 428 2,996 3,424 Total liabilities and r $7,440 $5,872 6,959 7,285 7,525 7,969


