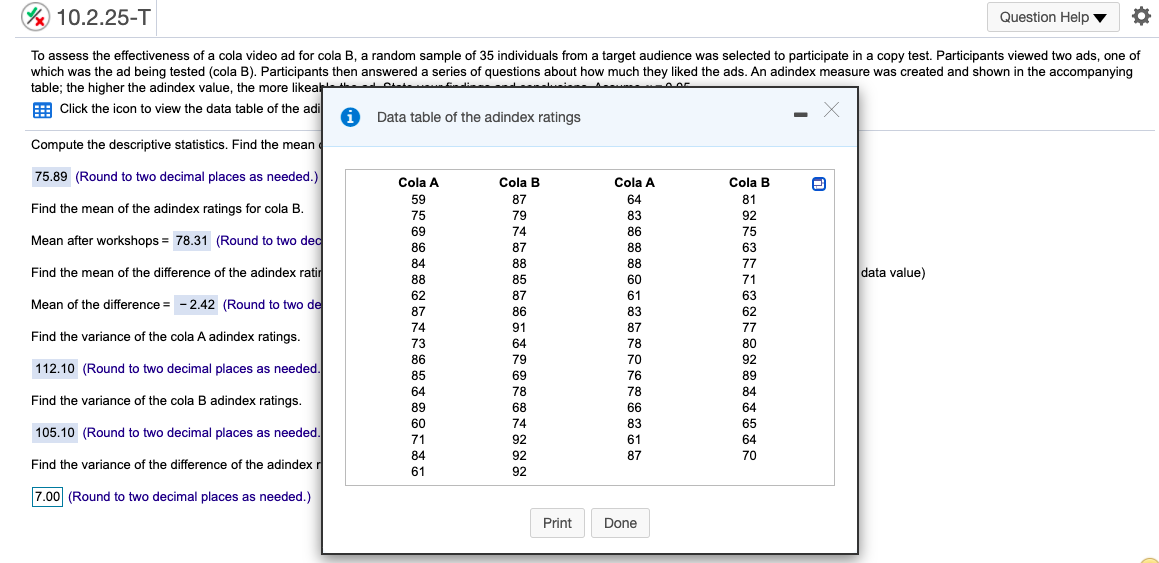
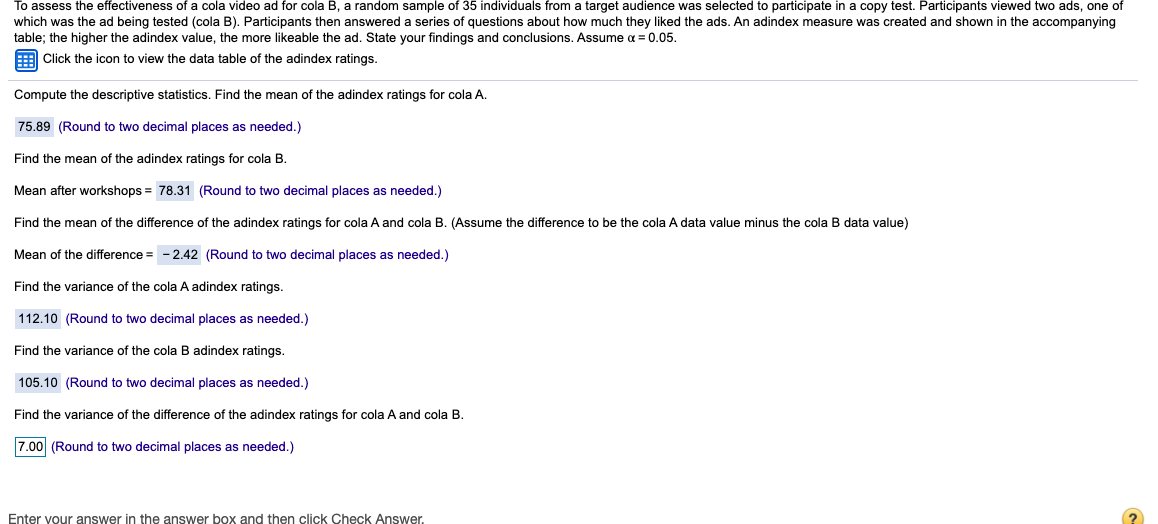
Please help in answering the questions below.
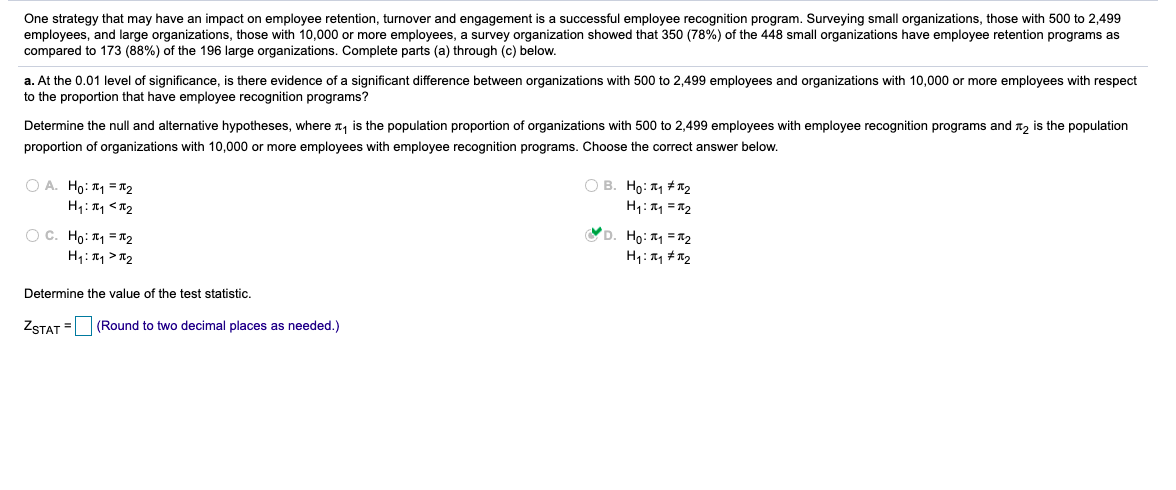
One strategy that may have an impact on employee retention, turnover and engagement is a successful employee recognition program. Surveying small organizations, those with 500 to 2,499 employees, and large organizations, those with 10,000 or more employees, a survey organization showed that 350 (78%) of the 448 small organizations have employee retention programs as compared to 173 (88%) of the 196 large organizations. Complete parts (a) through (c) below. a. At the 0.01 level of significance, is there evidence of a significant difference between organizations with 500 to 2,499 employees and organizations with 10,000 or more employees with respect to the proportion that have employee recognition programs? Determine the null and alternative hypotheses, where , is the population proportion of organizations with 500 to 2,499 employees with employee recognition programs and *2 is the population proportion of organizations with 10,000 or more employees with employee recognition programs. Choose the correct answer below. O A. HO: T1 = 12 OB. HO: my # #2 Hy: my 2 H1: my = 2 O C. Ho: 1 = 12 D. HO: My = 12 Hy : 1 1 > #2 Determine the value of the test statistic. ZSTAT = (Round to two decimal places as needed.)10.2.25-T Question Help To assess the effectiveness of a cola video ad for cola B, a random sample of 35 individuals from a target audience was selected to participate in a copy test. Participants viewed two ads, one of which was the ad being tested (cola B). Participants then answered a series of questions about how much they liked the ads. An adindex measure was created and shown in the accompanying table; the higher the adindex value, the more likeall- Click the icon to view the data table of the adi i Data table of the adindex ratings X Compute the descriptive statistics. Find the mean 75.89 (Round to two decimal places as needed.) Cola A Cola B Cola A Cola B 59 87 64 81 Find the mean of the adindex ratings for cola B. 75 79 83 92 69 74 86 75 Mean after workshops = 78.31 (Round to two dec 86 87 88 63 84 88 88 77 Find the mean of the difference of the adindex ratin 88 85 60 71 data value) 62 87 61 63 Mean of the difference = - 2.42 (Round to two de 87 86 83 62 74 91 87 77 Find the variance of the cola A adindex ratings. 73 64 78 80 86 79 70 92 112.10 (Round to two decimal places as needed. 85 69 76 89 64 78 78 84 Find the variance of the cola B adindex ratings. 89 68 66 64 60 74 83 65 105.10 (Round to two decimal places as needed 71 92 61 64 84 92 87 70 Find the variance of the difference of the adindex r 61 92 7.00 (Round to two decimal places as needed.) Print DoneTo assess the effectiveness of a cola video ad for cola B, a random sample of 35 individuals from a target audience was selected to participate in a copy test. Participants viewed two ads, one of which was the ad being tested (cola B). Participants then answered a series of questions about how much they liked the ads. An adindex measure was created and shown in the accompanying table; the higher the adindex value, the more likeable the ad. State your findings and conclusions. Assume a = 0.05. Click the icon to view the data table of the adindex ratings. Compute the descriptive statistics. Find the mean of the adindex ratings for cola A. 75.89 (Round to two decimal places as needed.) Find the mean of the adindex ratings for cola B. Mean after workshops = 78.31 (Round to two decimal places as needed.) Find the mean of the difference of the adindex ratings for cola A and cola B. (Assume the difference to be the cola A data value minus the cola B data value) Mean of the difference = -2.42 (Round to two decimal places as needed.) Find the variance of the cola A adindex ratings. 112.10 (Round to two decimal places as needed.) Find the variance of the cola B adindex ratings. 105.10 (Round to two decimal places as needed.) Find the variance of the difference of the adindex ratings for cola A and cola B. 7.00 (Round to two decimal places as needed.) the a then c Check


