

Answered step by step
Verified Expert Solution
Question
1 Approved Answer
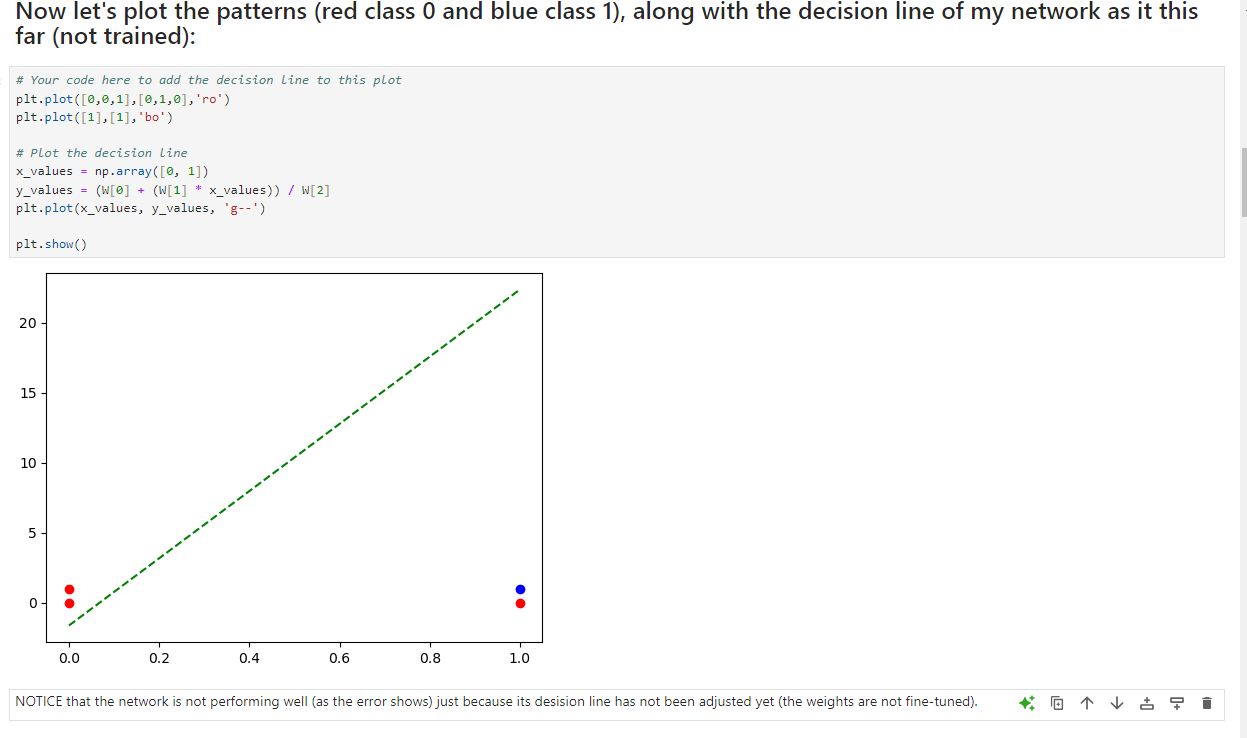
PLEASE HELP IN PYTHON I ' m having a problem in my perceptron code to plot the linear decision line boundary. I have my patterns
PLEASE HELP IN PYTHON
Im having a problem in my perceptron code to plot the linear decision line boundary.
I have my patterns as P nparray
I have my targets as T nparray
And I have my weights as W nparray but it can be any random number for the first two components with third one being the bias.
The red dots on the plot are represented as class but the blue dot are represented as class
pltplotro
pltplotbo
This is how I train the network.
def hardlimx:
return npwherex
A hardlimnpdotWP
E TA
rate
while sumE:
W W rate npdotE PT
A hardlimnpdotW P
E TA
How do I plot the linear decision boundary line so the network solves it flawselly. I need it so the blue dot is separated from the red dots with a linear line in the plot.
Step by Step Solution
There are 3 Steps involved in it
Step: 1

Get Instant Access to Expert-Tailored Solutions
See step-by-step solutions with expert insights and AI powered tools for academic success
Step: 2

Step: 3
Ace Your Homework with AI
Get the answers you need in no time with our AI-driven, step-by-step assistance
Get Started
Database And Expert Systems Applications 31st International Conference Dexa 2020 Bratislava Slovakia September 14 17 2020 Proceedings Part 1 Lncs 12391
Authors: Sven Hartmann ,Josef Kung ,Gabriele Kotsis ,A Min Tjoa ,Ismail Khalil
1st Edition