

Answered step by step
Verified Expert Solution
Question
1 Approved Answer
Please help its due tonight at midnight!!!! 4/22/22 Required information [The following information applies to the questions displayed below) Conroy Company manufactures two products-8100 and


Please help its due tonight at midnight!!!! 4/22/22 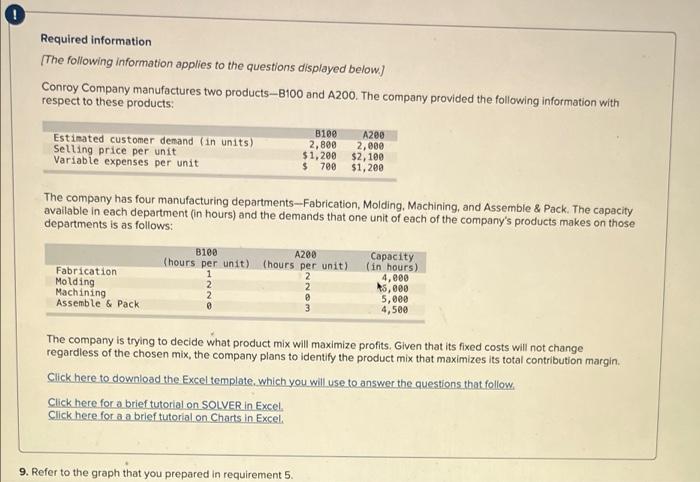

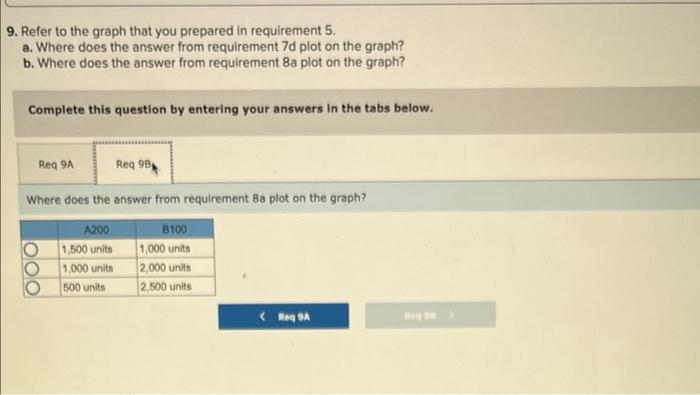
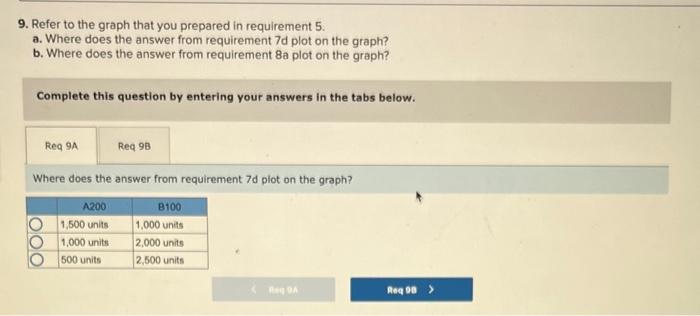
Required information [The following information applies to the questions displayed below) Conroy Company manufactures two products-8100 and A200. The company provided the following information with respect to these products: Estimated customer demand (in units) Selling price per unit Variable expenses per unit 8109 A200 2,800 2,000 $1,200 $2,100 $ 700 $1,200 The company has four manufacturing departments-Fabrication, Molding, Machining, and Assemble & Pack. The capacity available in each department (in hours) and the demands that one unit of each of the company's products makes on those departments is as follows: A200 (hours per unit) Fabrication Molding Machining Assemble & Pack B100 (hours per unit) 1 2 2 Capacity (in hours) 4,000 15,000 5,000 4,500 The company is trying to decide what product mix will maximize profits. Given that its fixed costs will not change regardless of the chosen mix, the company plans to identify the product mix that maximizes its total contribution margin. Click here to download the Excel template, which you will use to answer the questions that follow. Click here for a brief tutorial on SOLVER in Excel. Click here for a a brief tutorial on Charts in Excel 9. Refer to the graph that you prepared in requirement 5. 9. Refer to the graph that you prepared in requirement 5. a. Where does the answer from requirement 7d plot on the graph? b. Where does the answer from requirement 8a plot on the graph? Complete this question by entering your answers in the tabs below. Reg 9A Req 98 Where does the answer from requirement 7d plot on the graph? A200 B100 1,500 units 1,000 units 1,000 units 2.000 units 500 units 2,500 units Reg De > 9. Refer to the graph that you prepared in requirement 5. a. Where does the answer from requirement 7d plot on the graph? b. Where does the answer from requirement 8a plot on the graph? Complete this question by entering your answers in the tabs below. Reg 9A Reg 9B Where does the answer from requirement Ba plot on the graph? A200 1,500 units 1.000 units 500 units B100 1,000 units 2,000 units 2,500 units (Reg DA Required information [The following information applies to the questions displayed below) Conroy Company manufactures two products-8100 and A200. The company provided the following information with respect to these products: Estimated customer demand (in units) Selling price per unit Variable expenses per unit 8109 A200 2,800 2,000 $1,200 $2,100 $ 700 $1,200 The company has four manufacturing departments-Fabrication, Molding, Machining, and Assemble & Pack. The capacity available in each department (in hours) and the demands that one unit of each of the company's products makes on those departments is as follows: A200 (hours per unit) Fabrication Molding Machining Assemble & Pack B100 (hours per unit) 1 2 2 Capacity (in hours) 4,000 15,000 5,000 4,500 The company is trying to decide what product mix will maximize profits. Given that its fixed costs will not change regardless of the chosen mix, the company plans to identify the product mix that maximizes its total contribution margin. Click here to download the Excel template, which you will use to answer the questions that follow. Click here for a brief tutorial on SOLVER in Excel. Click here for a a brief tutorial on Charts in Excel 9. Refer to the graph that you prepared in requirement 5. 9. Refer to the graph that you prepared in requirement 5. a. Where does the answer from requirement 7d plot on the graph? b. Where does the answer from requirement 8a plot on the graph? Complete this question by entering your answers in the tabs below. Reg 9A Req 98 Where does the answer from requirement 7d plot on the graph? A200 B100 1,500 units 1,000 units 1,000 units 2.000 units 500 units 2,500 units Reg De > 9. Refer to the graph that you prepared in requirement 5. a. Where does the answer from requirement 7d plot on the graph? b. Where does the answer from requirement 8a plot on the graph? Complete this question by entering your answers in the tabs below. Reg 9A Reg 9B Where does the answer from requirement Ba plot on the graph? A200 1,500 units 1.000 units 500 units B100 1,000 units 2,000 units 2,500 units (Reg DA Step by Step Solution
There are 3 Steps involved in it
Step: 1

Get Instant Access to Expert-Tailored Solutions
See step-by-step solutions with expert insights and AI powered tools for academic success
Step: 2

Step: 3
Ace Your Homework with AI
Get the answers you need in no time with our AI-driven, step-by-step assistance
Get Started
Cost Management A Strategic Emphasis
Authors: Edward Blocher, David Stout, Paul Juras, Gary Cokins
7th edition
77733770, 978-0077733773