

Question
please help lol A mathematical model is a mathematical object (often a function or equation) which is used to represent and predict real-world data. In
please help lol
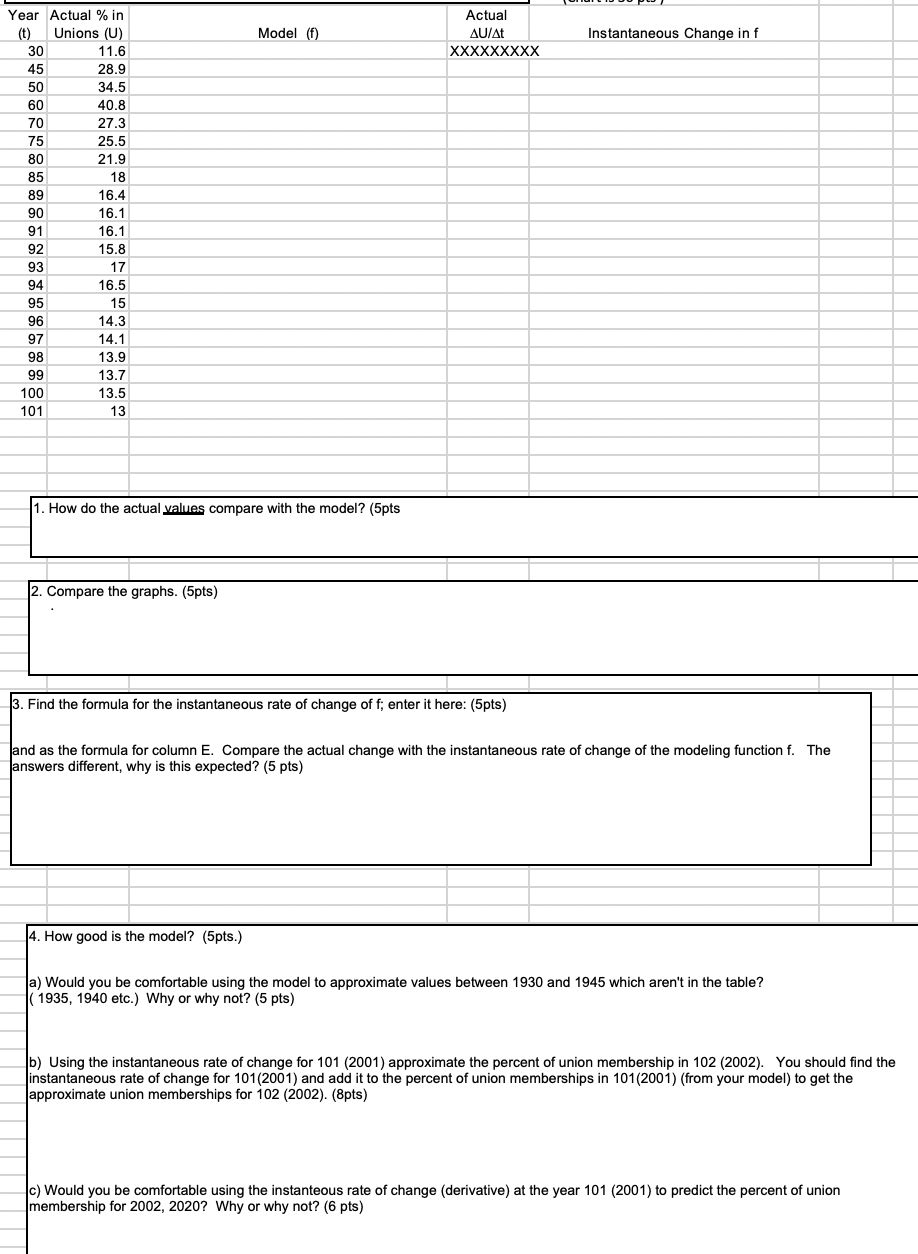
A mathematical model is a mathematical object (often a function or equation) which is used to represent and predict real-world data. In this lab, you're going to look at a mathematical model your text proposes for union membership data from 1930 through 2001, and look at how well it represents two things: the actual percent of union membership, and the changes in that percentage. (Very often, one is more interested in how such an index is changing than in its individual values.) The function your text proposes as a model for the percent of workers in unions for the years 1930 through 2001 is
f(t) = 0.0003869*t^3 - 0.08917*t^2 + 6.2503*t - 102.9
where t is the number of years since 1900. (Thus, f(75) represents the model's value of the percent of workers in unions in 1975.)
Theres 4 parts. - please make a graph on excel after completed all parts.
1. Enter the function above (you can simply use the copy, paste option, starting with the equals sign, after you've inserted the name t for the values in column A on the next sheet) in column C of the next sheet. Then, graph both the actual values of percent union membership and the model. Comment on how the graphs appear to match. (You will probably have to format the axes after you finish the graphs to get better graphs.)
2. Compare the values of the modeling function with the actual values.
3. Compute the instantaneous rate of change of the modeling function in column E (you have to find the derivative formula by hand, and then type this in as your formula for column E) and compare this with the actual rate of change in column D (which you have to find by taking the change in U from the time you're interested in to the next time, and divide by the number of years in between the times, (DU/Dt)).
4. Draw conclusions about how good the model is.
Step by Step Solution
There are 3 Steps involved in it
Step: 1

Get Instant Access to Expert-Tailored Solutions
See step-by-step solutions with expert insights and AI powered tools for academic success
Step: 2

Step: 3
Ace Your Homework with AI
Get the answers you need in no time with our AI-driven, step-by-step assistance
Get Started
Advances In Database Technology Edbt 94 4th International Conference On Extending Database Technology Cambridge United Kingdom March 1994 Proceedings Lncs 779
Authors: Matthias Jarke ,Janis Bubenko ,Keith Jeffery
1994th Edition
3540578188, 978-3540578185