Please help me and show me the excel functions as well! Thank you!! :)
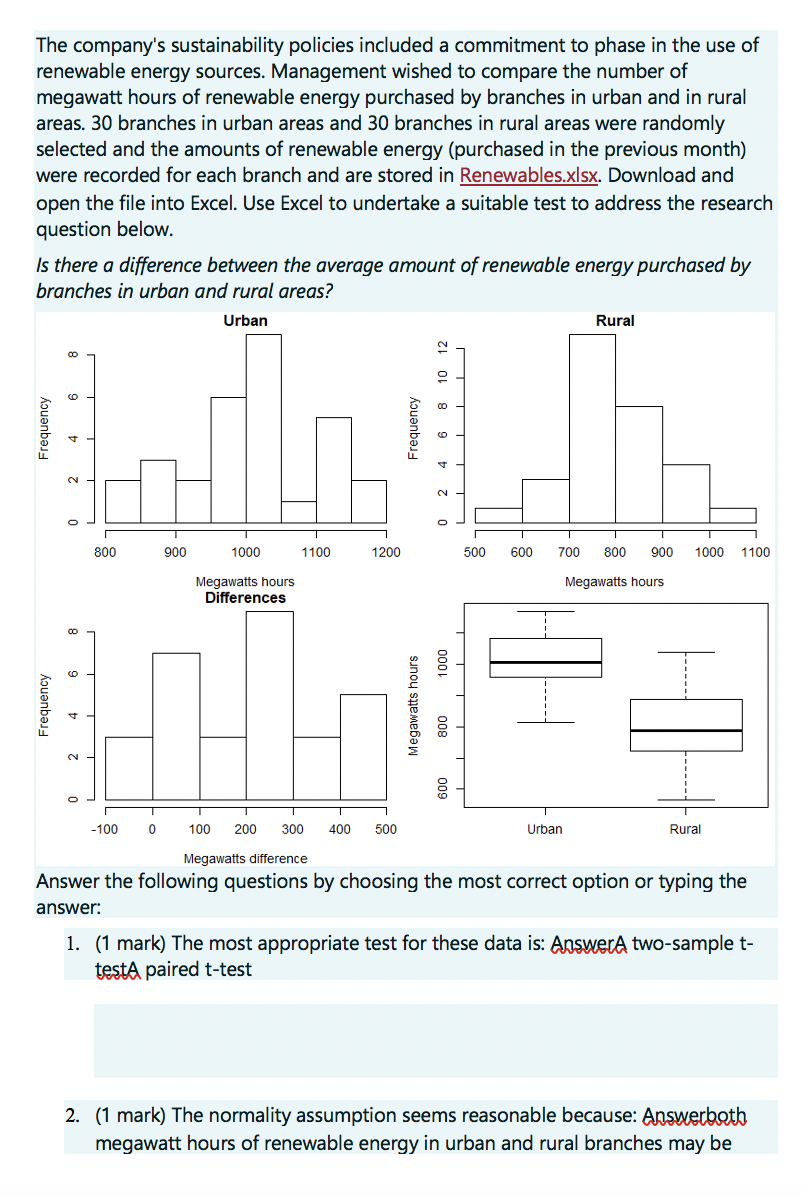
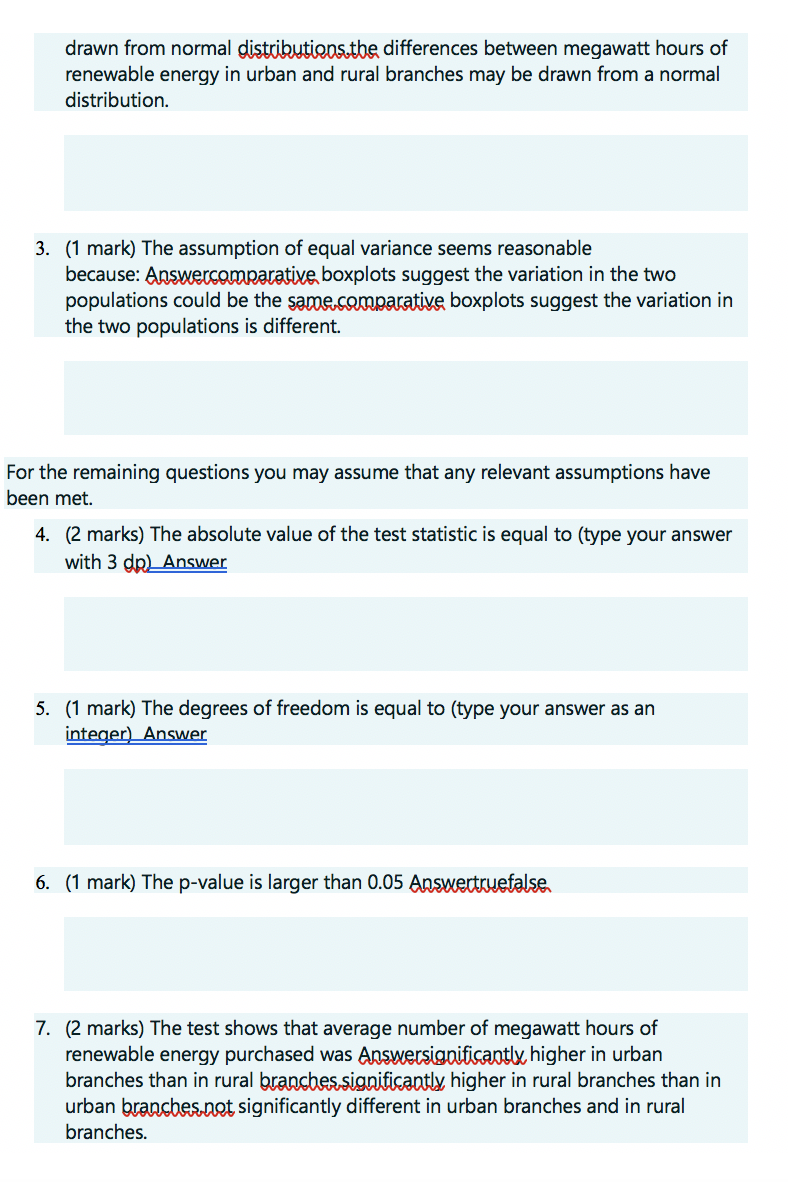
The company's sustainability policies included a commitment to phase in the use of renewable energy sources. Management wished to compare the number of megawatt hours of renewable energy purchased by branches in urban and in rural areas. 30 branches in urban areas and 30 branches in rural areas were randomly selected and the amounts of renewable energy (purchased in the previous month} were recorded for each branch and are stored in Renewablesarlsx. Download and open the file into Excel. Use Excel to undertake a suitable test to address the research question below. is there a a'ierence between the average amount of renewable energy purchased by branches in urban and rural areas? Urban Rural 1D 12 Frequency Frequency.r 6 | I I 1100 1200 500 600 T00 800 900 1000 1100 T N I N c, - .. I I 900 100-0 800 Megawatts hours Megawatts hours Differences Frequency .1 M egawatis hours 600 1 000 600 I I I | '100 0 100 200 300 400 500 Urban Rural Megawatts dierence Answer the following questions by choosing the most correct option or typing the answer: 1. (1 mark) The most appropriate test for these data is: memo-sample t- testa paired t-test 2. (1 mark) The normality assumption seems reasonable because: mm megawatt hours of renewable energy in urban and rural branches may be drawn from normal Wdierences between megawatt hours of renewable energy in urban and rural branches may be drawn from a normal distribution. 3. (1 mark) The assumption of equal variance seems reasonable because: Wboxplots suggest the variation in the two populations could be the W boxplots suggest the variation in the two populations is different For the remaining questions you may assume that any relevant assumptions have been met. 4. (2 marks) The absolute value of the test statistic is equal to (type your answer WNW 5. (1 mark) The degrees of freedom is equal to (type your answer as an wedM 6. (1 mark) The p-value is larger than 0.05 W 7. (2 marks) The test shows that average number of megawatt hours of renewable energy purchased was Whigher In urban branches than In rural Wally higher In rural branches than In urban Wsignicantly different In urban branches and In rural branches. Urban Rural 1107.6 783.93 857.28 791.19 1133.76 1040.3 949.3 855.87 1107.32 898.48 1019.19 711.73 815.43 844.86 1007.44 708.7 1083.96 635.59 958.67 943.18 1031.58 752.08 843.22 914.99 1126.62 780.62 1042.71 890.04 1166.13 746.79 1047.34 825.14 1108.33 681.88 1037.24 770.96 1170.4 721.24 990.14 781.28 929.8 856.22 1003.26 566.57 890.82 957.58 990.91 915.1 972.6 888.18 1004.2 804.24 871.96 687.68 981.64 704.81 998.94 769.46 1027.33 792.35


