

Answered step by step
Verified Expert Solution
Question
1 Approved Answer
Please help me answer parts d through i. thank you 3 4 4 3.5 5 6 4.5 4 O U 0 4 6 6 5
Please help me answer parts d through i. thank you
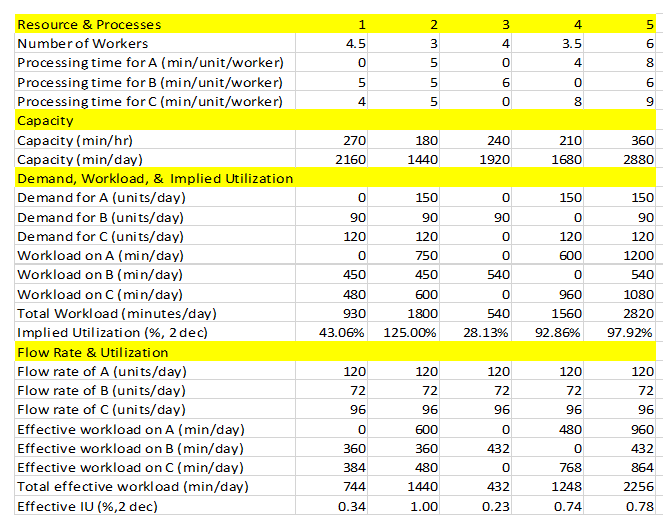
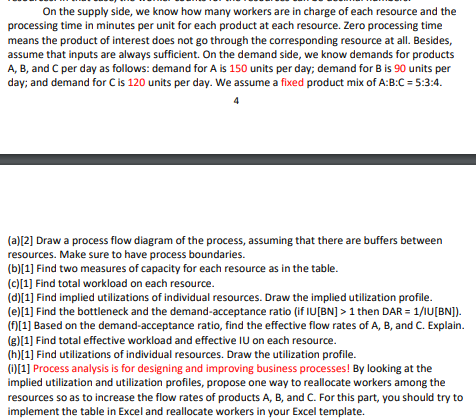
3 4 4 3.5 5 6 4.5 4 O U 0 4 6 6 5 4 O O 00 9 270 210 180 1440 240 1920 360 2880 2160 1680 0 150 O 150 0 150 90 90 90 90 120 120 0 120 120 Resource & Processes Number of Workers Processing time for A (min/unit/worker) Processing time for B (min/unit/worker) Processing time for C(min/unit/worker) Capacity Capacity (min/hr) Capacity (min/day) Demand, Workload, & Implied Utilization Demand for A (units/day) Demand for B (units/day) Demand for C(units/day) Workload on A (min/day) Workload on B (min/day) Workload on C(min/day) Total Workload (minutes/day) Implied Utilization (%, 2 dec) Flow Rate & Utilization Flow rate of A (units/day) Flow rate of B (units/day) Flow rate of C(units/day) Effective workload on A (min/day) Effective workload on B (min/day) Effective workload on C(min/day) Total effective workload (min/day) Effective IU (%,2 dec) 750 450 600 0 0 450 480 930 43.06% 600 1800 125.00% 0 540 0 540 28.13% 960 1560 92.86% 1200 540 1080 2820 97.92% 120 120 120 120 72 72 72 72 96 120 72 96 96 96 96 0 0 960 600 360 480 0 432 432 360 384 480 0 864 2256 744 1440 432 0.23 768 1248 0.74 0.34 1.00 0.78 On the supply side, we know how many workers are in charge of each resource and the processing time in minutes per unit for each product at each resource. Zero processing time means the product of interest does not go through the corresponding resource at all. Besides, assume that inputs are always sufficient. On the demand side, we know demands for products A, B, and C per day as follows: demand for A is 150 units per day; demand for B is 90 units per day; and demand for Cis 120 units per day. We assume a fixed product mix of A:B:C = 5:3:4. 4 (a)[2] Draw a process flow diagram of the process, assuming that there are buffers between resources. Make sure to have process boundaries. (b)[1] Find two measures of capacity for each resource as in the table. (c)[1] Find total workload on each resource. (d)[1] Find implied utilizations of individual resources. Draw the implied utilization profile. (e)[1] Find the bottleneck and the demand-acceptance ratio (if IU[BN] > 1 then DAR = 1/1U[BN]). (f)[1] Based on the demand-acceptance ratio, find the effective flow rates of A, B, and C. Explain. (g)[1] Find total effective workload and effective IU on each resource. (h)[1] Find utilizations of individual resources. Draw the utilization profile. 0 [1] Process analysis is for designing and improving business processes! By looking at the implied utilization and utilization profiles, propose one way to reallocate workers among the resources so as to increase the flow rates of products A, B, and C. For this part, you should try to implement the table in Excel and reallocate workers in your Excel template. 3 4 4 3.5 5 6 4.5 4 O U 0 4 6 6 5 4 O O 00 9 270 210 180 1440 240 1920 360 2880 2160 1680 0 150 O 150 0 150 90 90 90 90 120 120 0 120 120 Resource & Processes Number of Workers Processing time for A (min/unit/worker) Processing time for B (min/unit/worker) Processing time for C(min/unit/worker) Capacity Capacity (min/hr) Capacity (min/day) Demand, Workload, & Implied Utilization Demand for A (units/day) Demand for B (units/day) Demand for C(units/day) Workload on A (min/day) Workload on B (min/day) Workload on C(min/day) Total Workload (minutes/day) Implied Utilization (%, 2 dec) Flow Rate & Utilization Flow rate of A (units/day) Flow rate of B (units/day) Flow rate of C(units/day) Effective workload on A (min/day) Effective workload on B (min/day) Effective workload on C(min/day) Total effective workload (min/day) Effective IU (%,2 dec) 750 450 600 0 0 450 480 930 43.06% 600 1800 125.00% 0 540 0 540 28.13% 960 1560 92.86% 1200 540 1080 2820 97.92% 120 120 120 120 72 72 72 72 96 120 72 96 96 96 96 0 0 960 600 360 480 0 432 432 360 384 480 0 864 2256 744 1440 432 0.23 768 1248 0.74 0.34 1.00 0.78 On the supply side, we know how many workers are in charge of each resource and the processing time in minutes per unit for each product at each resource. Zero processing time means the product of interest does not go through the corresponding resource at all. Besides, assume that inputs are always sufficient. On the demand side, we know demands for products A, B, and C per day as follows: demand for A is 150 units per day; demand for B is 90 units per day; and demand for Cis 120 units per day. We assume a fixed product mix of A:B:C = 5:3:4. 4 (a)[2] Draw a process flow diagram of the process, assuming that there are buffers between resources. Make sure to have process boundaries. (b)[1] Find two measures of capacity for each resource as in the table. (c)[1] Find total workload on each resource. (d)[1] Find implied utilizations of individual resources. Draw the implied utilization profile. (e)[1] Find the bottleneck and the demand-acceptance ratio (if IU[BN] > 1 then DAR = 1/1U[BN]). (f)[1] Based on the demand-acceptance ratio, find the effective flow rates of A, B, and C. Explain. (g)[1] Find total effective workload and effective IU on each resource. (h)[1] Find utilizations of individual resources. Draw the utilization profile. 0 [1] Process analysis is for designing and improving business processes! By looking at the implied utilization and utilization profiles, propose one way to reallocate workers among the resources so as to increase the flow rates of products A, B, and C. For this part, you should try to implement the table in Excel and reallocate workers in your Excel templateStep by Step Solution
There are 3 Steps involved in it
Step: 1

Get Instant Access to Expert-Tailored Solutions
See step-by-step solutions with expert insights and AI powered tools for academic success
Step: 2

Step: 3
Ace Your Homework with AI
Get the answers you need in no time with our AI-driven, step-by-step assistance
Get Started
Day Trading Strategies And Risk Management
Authors: Richard N. Williams
1st Edition
979-8863610528