Please help me answer the following question. Thank you
Question 7
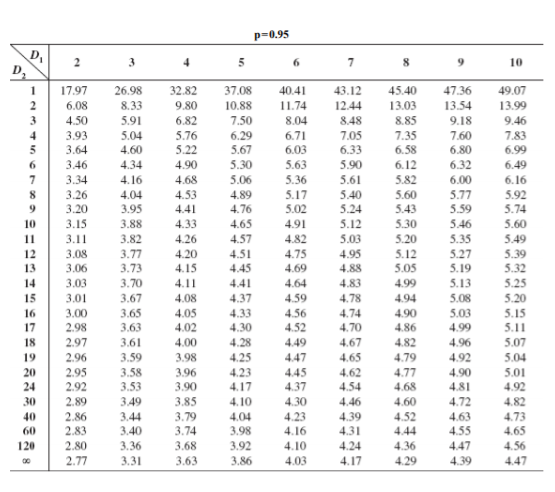
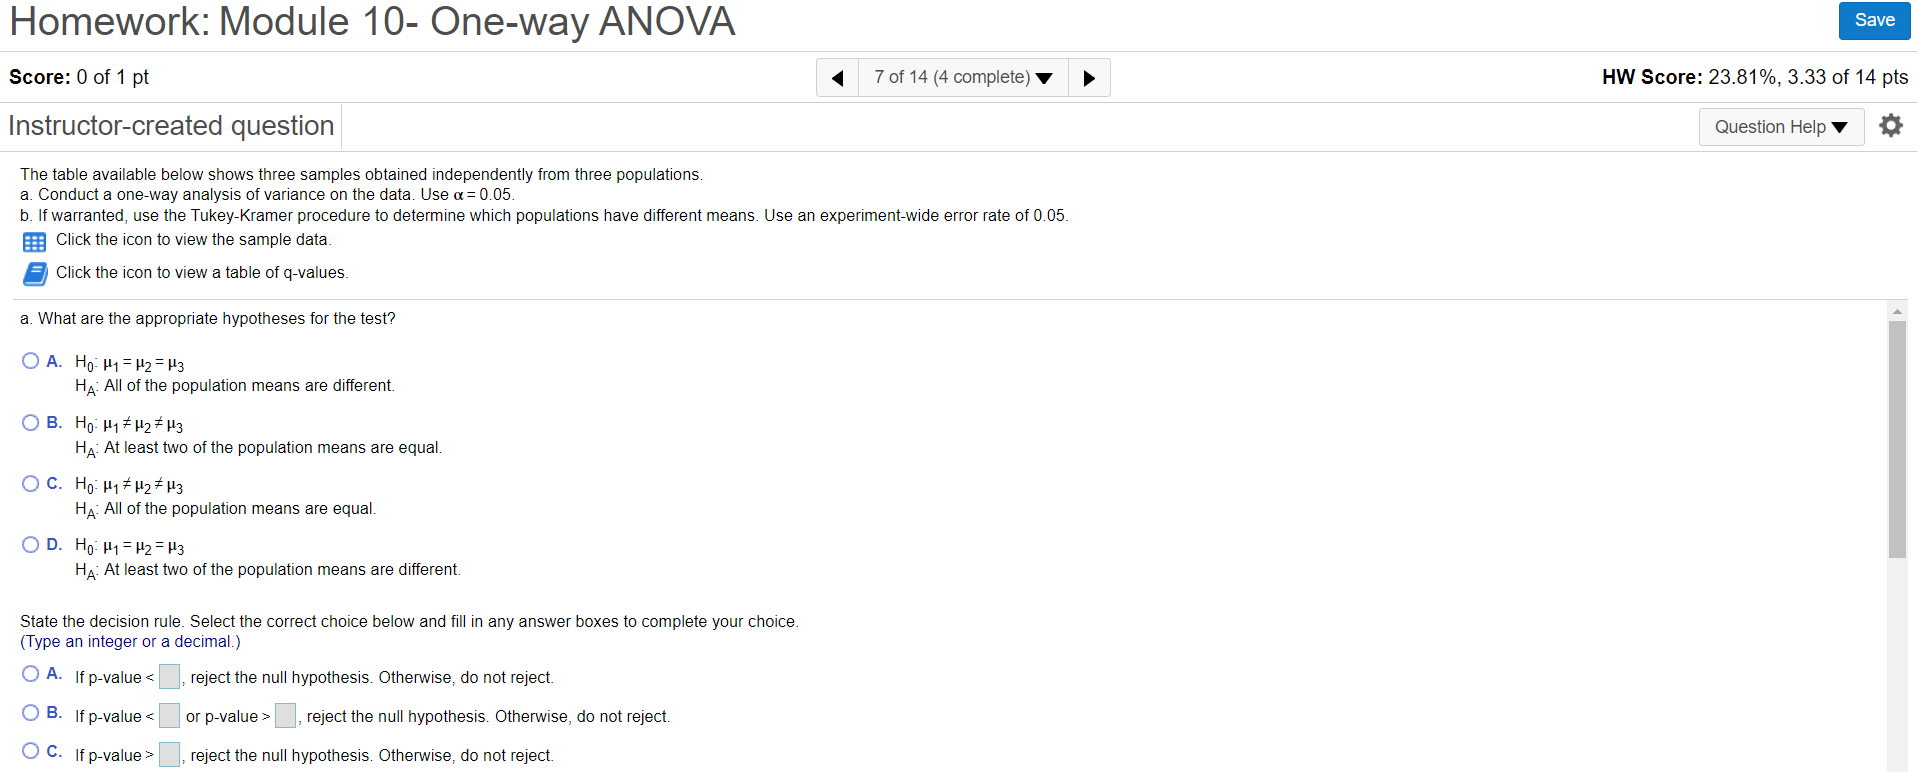
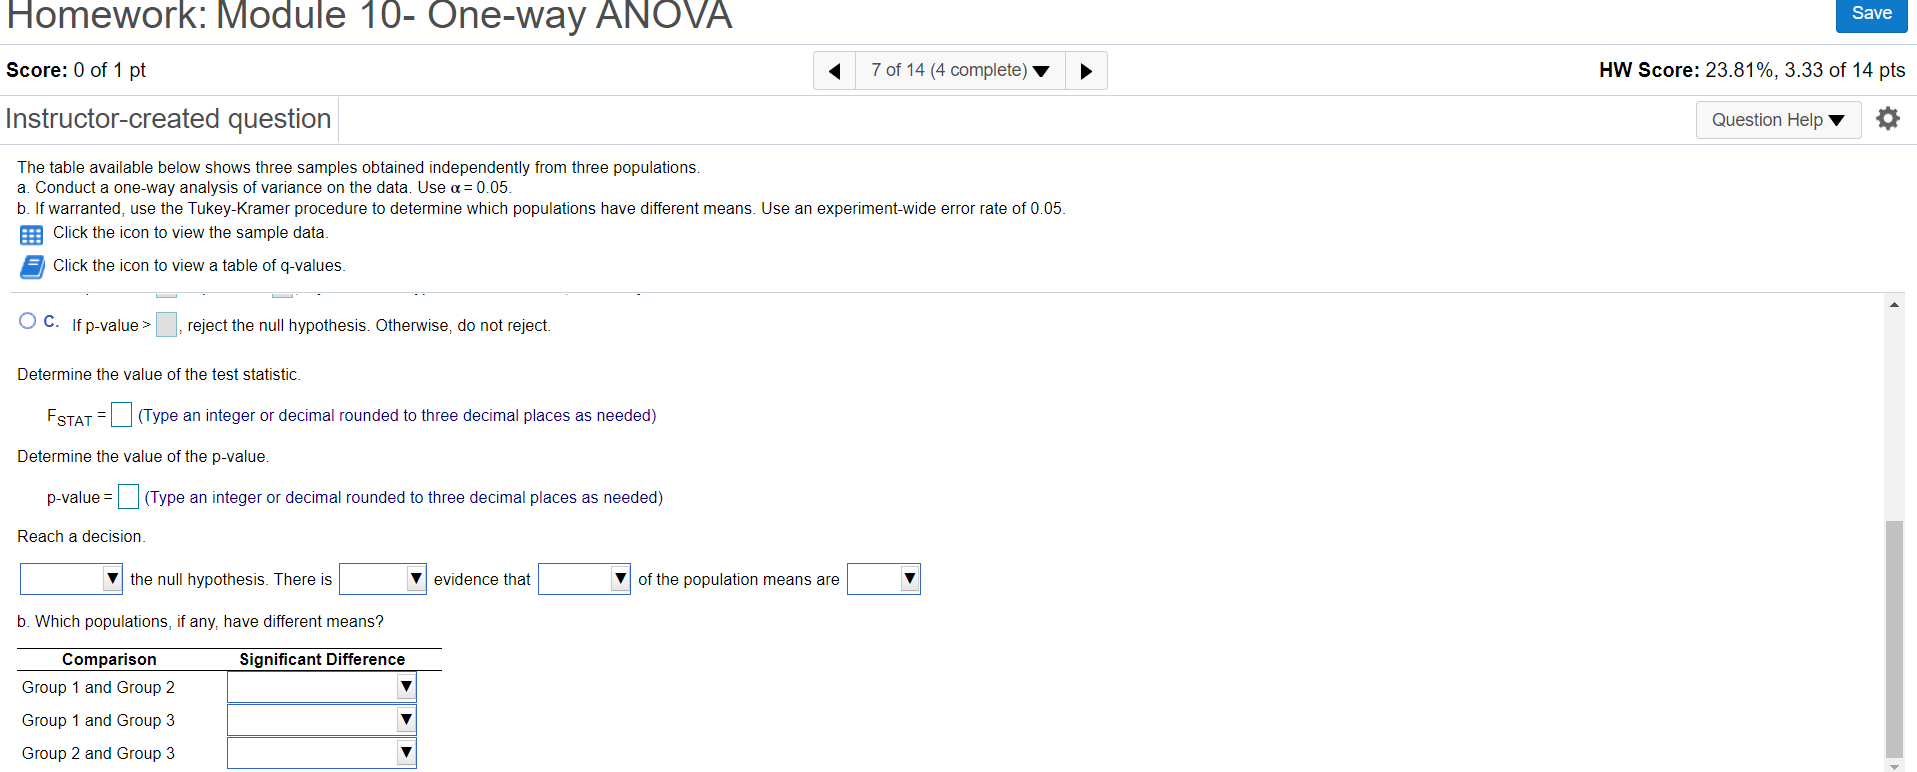
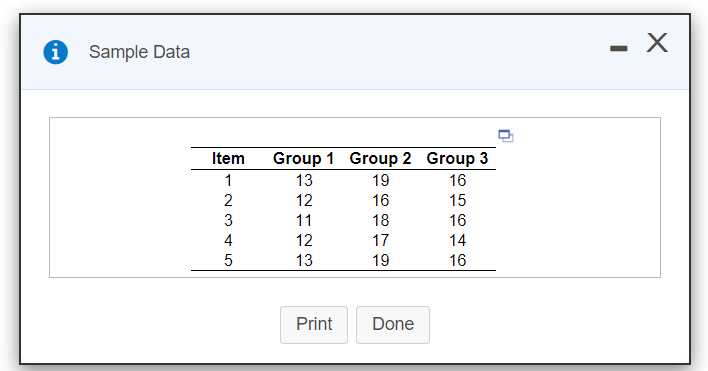
p=0.95 4 5 7 10 17.97 26.98 32.82 37.08 40.41 43.12 45.40 47.36 49.07 6.08 8.33 9.80 10.88 11.74 12.44 13.03 13.54 13.99 4.50 5.91 6.82 7.50 8.04 8.48 8.85 9.18 9.46 3.93 5.04 5.76 6.29 6.71 7.05 7.35 7.60 7.83 3.64 4.60 5.22 5.67 6.03 6.33 6.58 6.80 6.99 3.46 4.34 4.90 5.30 5.63 5.90 6.12 6.32 6.49 3.34 4.16 4.68 5.06 5.36 5.61 5.82 6.00 6.16 3.26 4.04 4.53 4.89 5.17 5.40 5.60 5.77 5.92 3.20 3.95 4.41 4.76 5.02 5.24 5.43 5.59 5.74 10 3.15 3.88 4.33 4.65 4.91 5.12 5.30 5.46 5.60 11 3.11 3.82 4.26 4.57 4.82 5.03 5.20 5.35 5.49 12 3.08 3.77 4.20 4.51 4.75 4.95 5.12 5.27 5.39 13 3.06 3.73 4.15 4.45 4.69 4.88 5.05 5.19 5.32 14 3.03 3.70 4.11 4.41 4.64 4.83 4.99 5.13 5.25 15 3.01 3.67 4.08 4.37 4.59 4.78 4.94 5.08 5.20 16 3.00 3.65 4.05 4.33 4.56 4.74 4.90 5.03 5.15 17 2.98 3.63 4.02 4.30 4.52 4.70 4.86 4.99 5.11 18 2.97 3.61 4.00 4.28 4.49 4.67 4.82 4.96 5.07 19 2.96 3.59 3.98 4.25 4.47 4,65 4.79 4.92 5.04 20 2.95 3.58 3.96 4.23 4.45 4.62 4.77 4.90 5.01 24 2.92 3.53 3.90 4.17 4.37 4.54 4.68 4.81 4.92 30 2.89 3.49 3.85 4.10 4.30 4.46 4.60 4.72 4.82 40 2.86 3.44 3.79 4.04 4.23 4.39 4.52 4.63 4.73 60 2.83 3.40 3.74 3.98 4.16 4.31 4.44 4.55 4.65 120 2.80 3.36 3.68 3.92 4.10 4.24 4.36 4.47 4.56 2.77 3.31 3.63 3.86 4.03 4.17 4.29 4.39 4.47Homework: Module 10- One-way ANOVA Save Score: 0 of 1 pt 7 of 14 (4 complete) HW Score: 23.81%, 3.33 of 14 pts Instructor-created question Question Help The table available below shows three samples obtained independently from three populations. a. Conduct a one-way analysis of variance on the data. Use a = 0.05. b. If warranted, use the Tukey-Kramer procedure to determine which populations have different means. Use an experiment-wide error rate of 0.05. Click the icon to view the sample data. Click the icon to view a table of q-values. a. What are the appropriate hypotheses for the test? O A. HO H1 = H2 = H3 HA: All of the population means are different. OB. HO H1 # #2 # 13 HA: At least two of the population means are equal. O C. Ho: My # H2 # H3 HA: All of the population means are equal. OD. HO- M1 = H2 = H3 HA: At least two of the population means are different. State the decision rule. Select the correct choice below and fill in any answer boxes to complete your choice. (Type an integer or a decimal.) O A. If p-value , reject the null hypothesis. Otherwise, do not reject. O C. If p-value > , reject the null hypothesis. Otherwise, do not reject.Homework: Module 10- One-way ANOVA Save Score: 0 of 1 pt 4 7 of 14 (4 complete) HW Score: 23.81%, 3.33 of 14 pts Instructor-created question Question Help The table available below shows three samples obtained independently from three populations. a. Conduct a one-way analysis of variance on the data. Use a = 0.05. b. If warranted, use the Tukey-Kramer procedure to determine which populations have different means. Use an experiment-wide error rate of 0.05. Click the icon to view the sample data Click the icon to view a table of q-values. O C. If p-value > , reject the null hypothesis. Otherwise, do not reject. Determine the value of the test statistic. FSTAT = (Type an integer or decimal rounded to three decimal places as needed) Determine the value of the p-value. p-value = (Type an integer or decimal rounded to three decimal places as needed) Reach a decision. the null hypothesis. There is evidence that of the population means are b. Which populations, if any, have different means? Comparison Significant Difference Group 1 and Group 2 Group 1 and Group 3 Group 2 and Group 3i Sample Data X Item Group 1 Group 2 Group 3 13 19 16 12 16 15 11 18 16 12 17 14 13 19 16 Print Done