please help me answer this question , thanks !
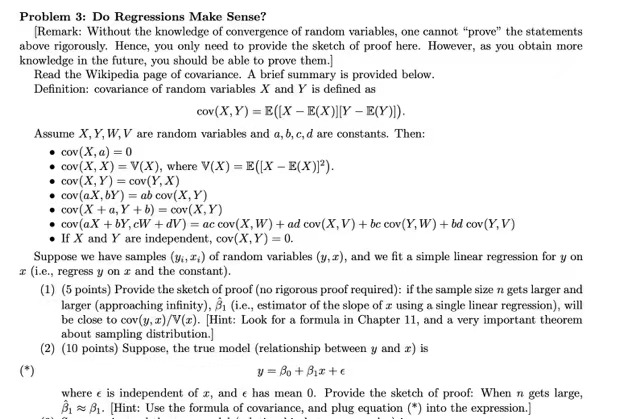
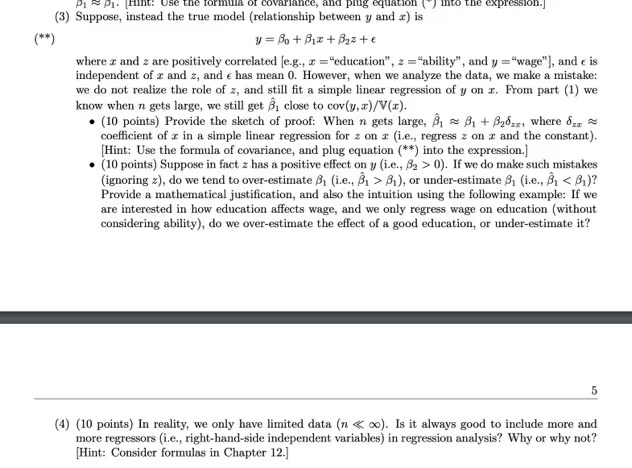
Problem 3: Do Regressions Make Sense? [Remark: Without the knowledge of convergence of random variables, one cannot "prove" the statements above rigorously. Hence, you only need to provide the sketch of proof here. However, as you obtain more knowledge in the future, you should be able to prove them.] Read the Wikipedia page of covariance. A brief summary is provided below. Definition: covariance of random variables X and Y is defined as cov(X, Y) = E([X - E(X)][Y - E(Y)]). Assume X, Y, W, V are random variables and a, b, c, d are constants. Then: . cov (X, a) = 0 . cov (X, X) = V(X), where V(X) = E([X - E(X)]'). . cov (X, Y) = cov(Y, X) . cov(aX, by ) = ab cov( X, Y) . cov (X + a, Y +b) = cov(X, Y) . cov(aX + bY, cW + dV) = ac cov(X, W) + ad cov(X, V) + be cov(Y, W) + bd cov (Y, V) . If X and Y are independent, cov(X, Y) = 0. Suppose we have samples (y., r,) of random variables (y, r), and we fit a simple linear regression for y on (i.e., regress y on r and the constant). (1) (5 points) Provide the sketch of proof (no rigorous proof required): if the sample size n gets larger and larger (approaching infinity), 81 (i.e., estimator of the slope of a using a single linear regression), will be close to cov(y, x)/V(x). [Hint: Look for a formula in Chapter 11, and a very important theorem about sampling distribution.] (2) (10 points) Suppose, the true model (relationship between y and r) is (* ) 1 = Bo + Biate where e is independent of x, and e has mean 0. Provide the sketch of proof: When n gets large, 8 81. Hint: Use the formula of covariance, and plug equation (*) into the expression.]Pi Pi. Hint: Use the formula of covariance, and piug equation [ ] mito the expression.] (3) Suppose, instead the true model (relationship between y and r) is (*# ) y = Bo + Bix+ Bazte where z and z are positively correlated [e.g., z ="education", = ="ability", and y ="wage"], and e is independent of r and z, and e has mean 0. However, when we analyze the data, we make a mistake: we do not realize the role of z, and still fit a simple linear regression of y on r. From part (1) we know when n gets large, we still get B, close to cov(y, s)/V(x). . (10 points) Provide the sketch of proof: When n gets large, 8 2 8 + 82ozz, where or, coefficient of x in a simple linear regression for z on a (i.e., regress z on a and the constant). [Hint: Use the formula of covariance, and plug equation (**) into the expression.] . (10 points) Suppose in fact z has a positive effect on y (i.e., 82 > 0). If we do make such mistakes (ignoring =), do we tend to over-estimate S, (i.e., 8, > 8,), or under-estimate S (i.e., B,