

Question
Please help me answered the following with the giving data. Charactaristics of Golden Age: Strengthening social safety net, high minimum wage, 30% of workers belong
Please help me answered the following with the giving data.
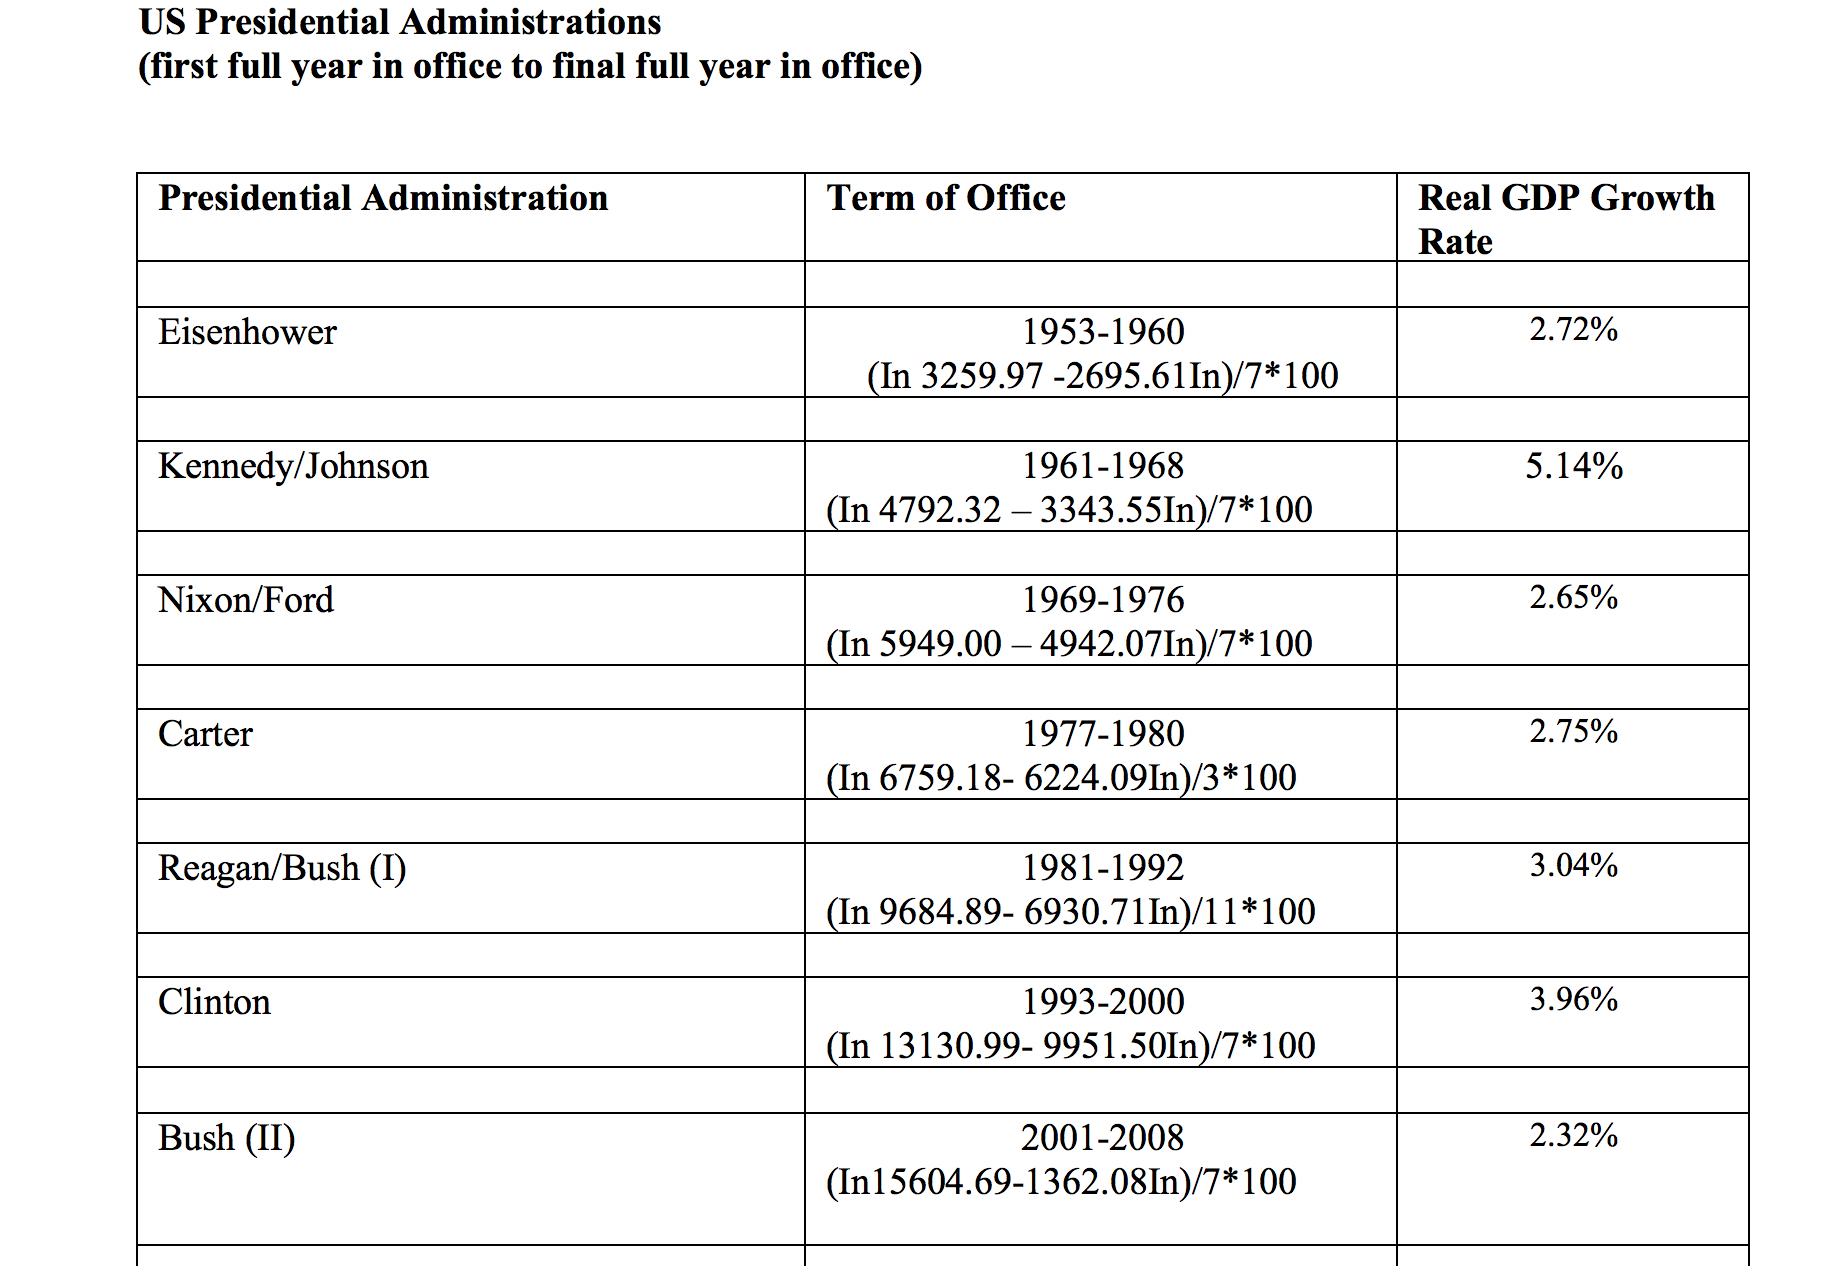
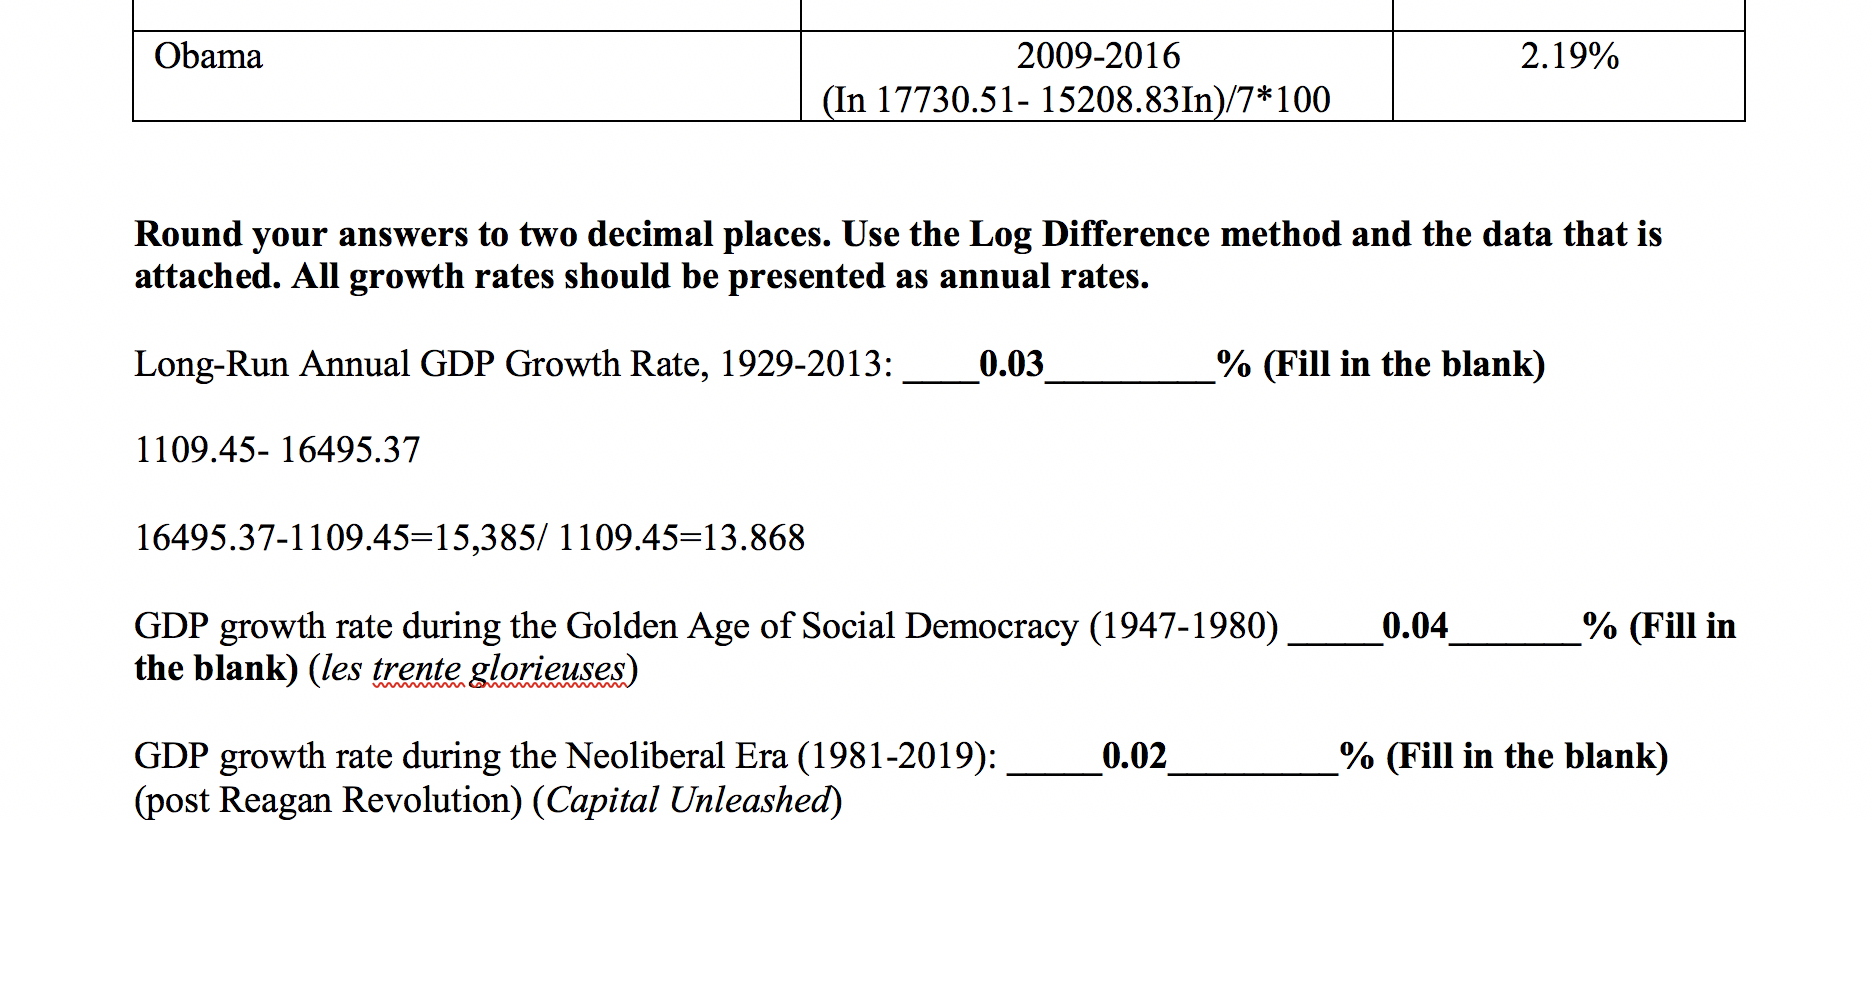
Charactaristics of Golden Age: Strengthening social safety net, high minimum wage, 30% of workers belong to unions, high marginal tax rates on high incomes (over 90% in 1950s), strict regulation of "Wall Street," least inequality of wealth and income in American history.
Characteristics of Neoliberal Era: Weakening social safety net, falling minimum wage, under 10% of workers belong to unions, marginal tax rates on high incomes under 40% (dividends and capital gains taxed at 15%), deregulation of"Wall Street", growing inequality of wealth and income.
QUESTION: Does GDP data support the claim that there is a trade-off between equality and efficiency? That is, does the data support the claim that greater economic equality in society would cause the rate of growth of GDP to decline? Explain why or why not.
Step by Step Solution
There are 3 Steps involved in it
Step: 1

Get Instant Access to Expert-Tailored Solutions
See step-by-step solutions with expert insights and AI powered tools for academic success
Step: 2

Step: 3
Ace Your Homework with AI
Get the answers you need in no time with our AI-driven, step-by-step assistance
Get Started
Principles of economics
Authors: N. Gregory Mankiw
6th Edition
978-0538453059, 9781435462120, 538453052, 1435462122, 978-0538453042