Please help me code the following in: JAVA
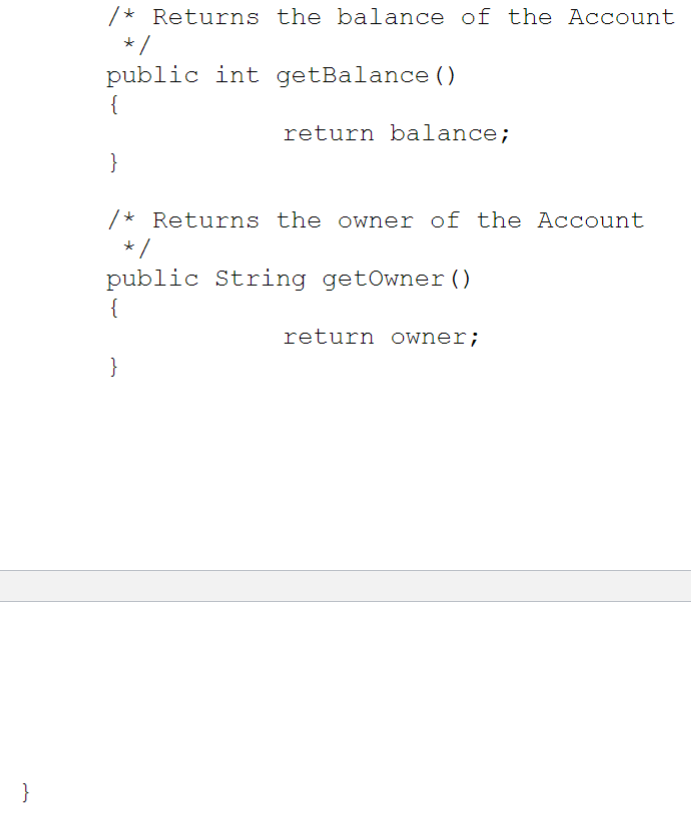 DebugMeExercise class:
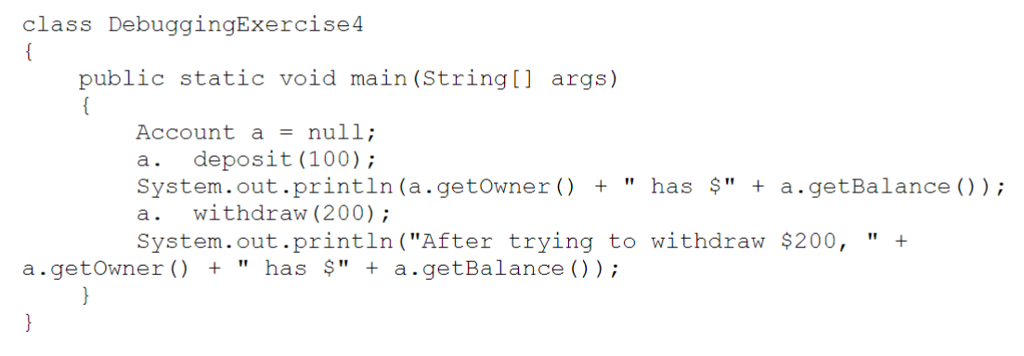
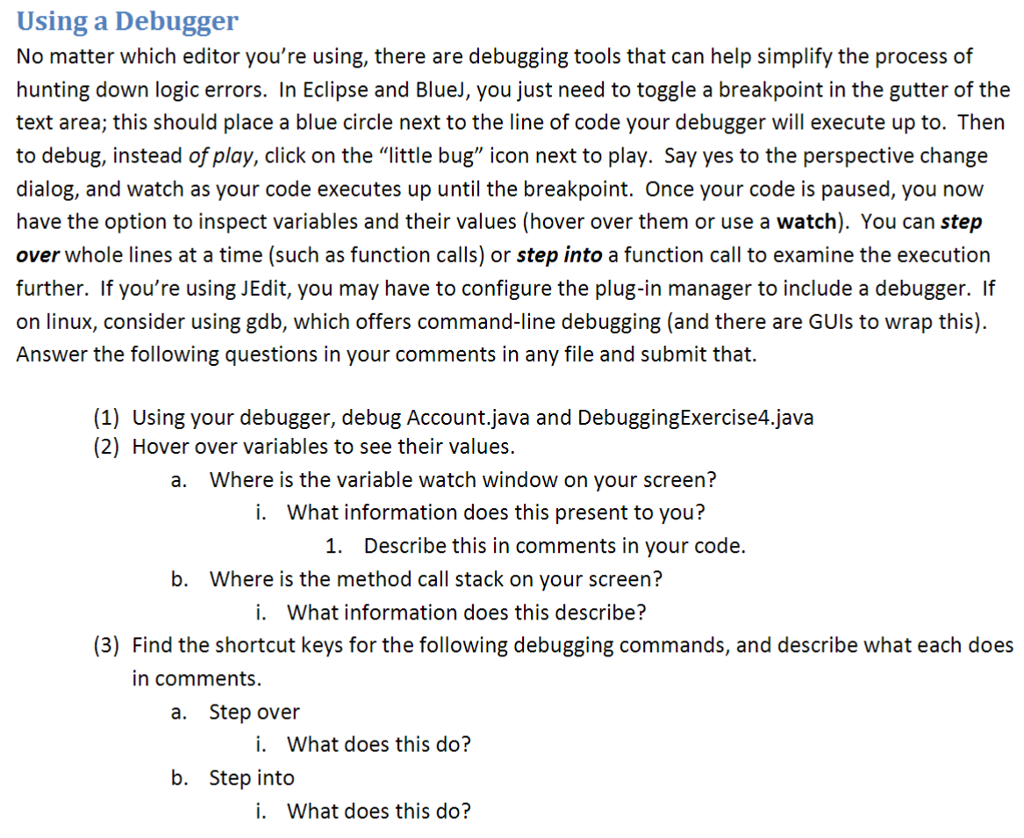
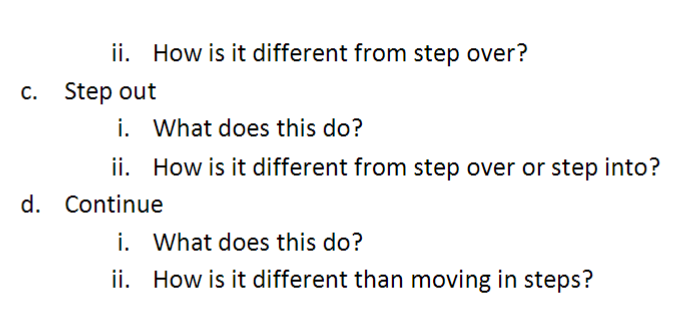
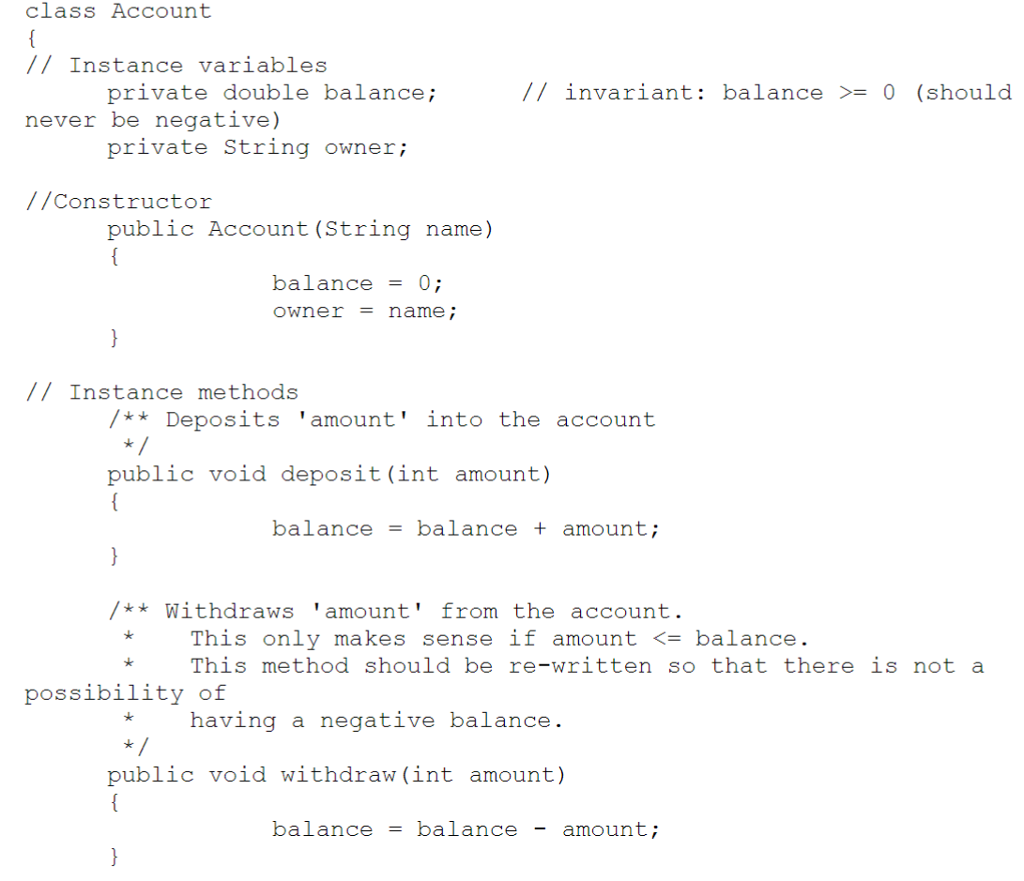
Using a Debugger No matter which editor you're using, there are debugging tools that can help simplify the process of hunting down logic errors. In Eclipse and Bluel, you just need to toggle a breakpoint in the gutter of the text area; this should place a blue circle next to the line of code your debugger will execute up to. Thern to debug, instead of play, click on the "little bug" icon next to play. Say yes to the perspective change dialog, and watch as your code executes up until the breakpoint. Once your code is paused, you now have the option to inspect variables and their values (hover over them or use a watch). You can step over whole lines at a time (such as function calls) or step into a function call to examine the execution further. If you're using JEdit, you may have to configure the plug-in manager to include a debugger. If on linux, consider using gdb, which offers command-line debugging (and there are GUls to wrap this). Answer the following questions in your comments in any file and submit that. (1) Using your debugger, debug Account,java and DebuggingExercise4.java (2) Hover over variables to see their values. a. Where is the variable watch window on your screen? i. What information does this present to you? 1. Describe this in comments in your code. b. Where is the method call stack on your screen? i. What information does this describe? (3) Find the shortcut keys for the following debugging commands, and describe what each does in comments. a. Step over i. What does this do? b. Step into i. What does this do? Using a Debugger No matter which editor you're using, there are debugging tools that can help simplify the process of hunting down logic errors. In Eclipse and Bluel, you just need to toggle a breakpoint in the gutter of the text area; this should place a blue circle next to the line of code your debugger will execute up to. Thern to debug, instead of play, click on the "little bug" icon next to play. Say yes to the perspective change dialog, and watch as your code executes up until the breakpoint. Once your code is paused, you now have the option to inspect variables and their values (hover over them or use a watch). You can step over whole lines at a time (such as function calls) or step into a function call to examine the execution further. If you're using JEdit, you may have to configure the plug-in manager to include a debugger. If on linux, consider using gdb, which offers command-line debugging (and there are GUls to wrap this). Answer the following questions in your comments in any file and submit that. (1) Using your debugger, debug Account,java and DebuggingExercise4.java (2) Hover over variables to see their values. a. Where is the variable watch window on your screen? i. What information does this present to you? 1. Describe this in comments in your code. b. Where is the method call stack on your screen? i. What information does this describe? (3) Find the shortcut keys for the following debugging commands, and describe what each does in comments. a. Step over i. What does this do? b. Step into i. What does this do