PLEASE HELP ME CODE THIS IN SIMULINK(MATLAB)
PLEASE ANSWER QUESTION 11, 19,20,21
NO. 8- 20 are assigned for a steps-by-step method to get these 2 waves written below:(i & ii)
i) In this lab, let us generate a sin(8t). SIMULINK
ii) Now design a Simulink file to visualize sin(4t) + sin(8t)
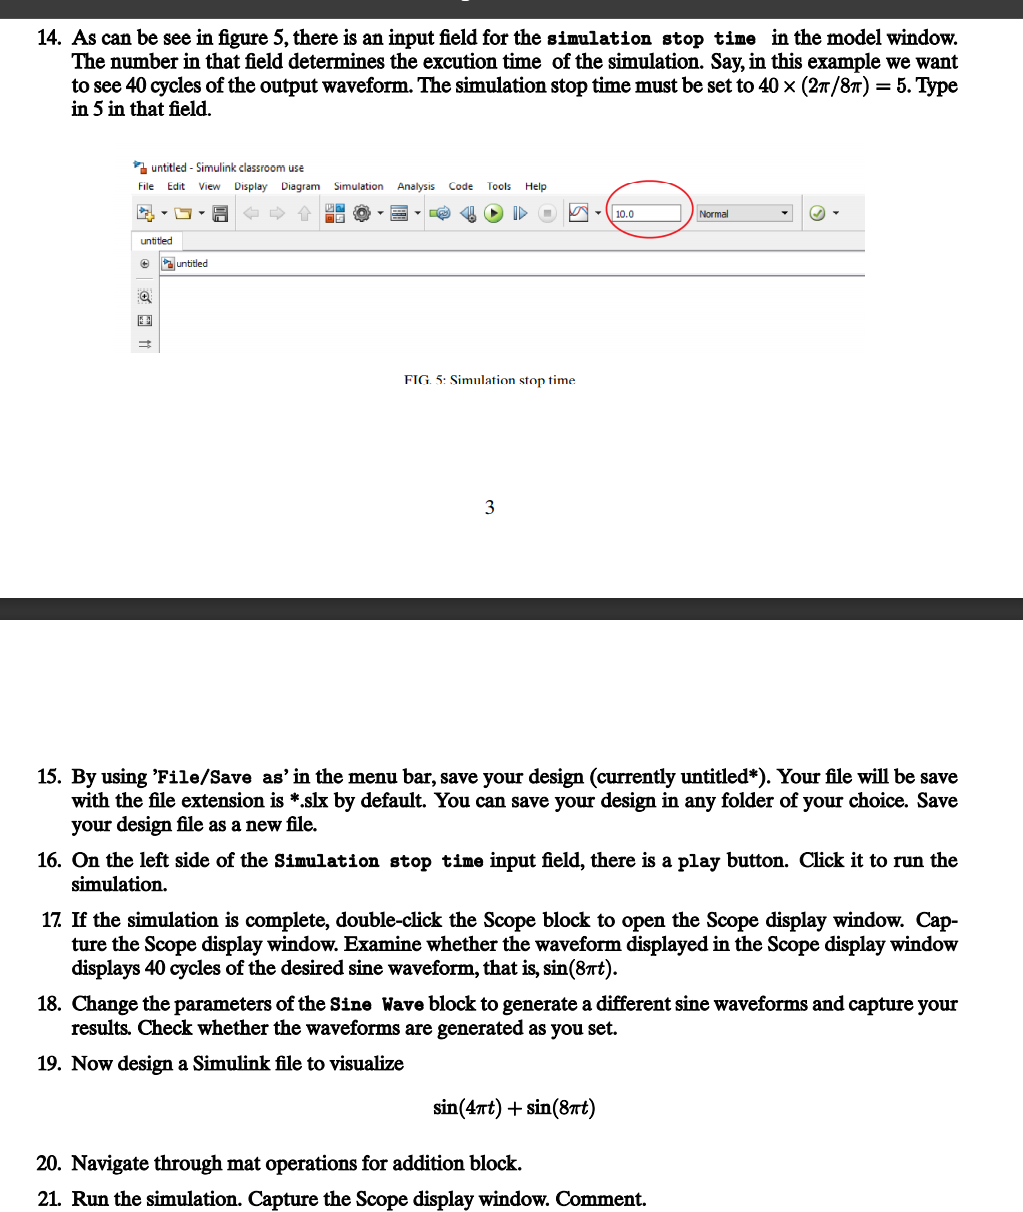
. Navigate through mat operations for addition block. 21. Run the simulation. Capture the Scope display window and Comment codes
Steps:


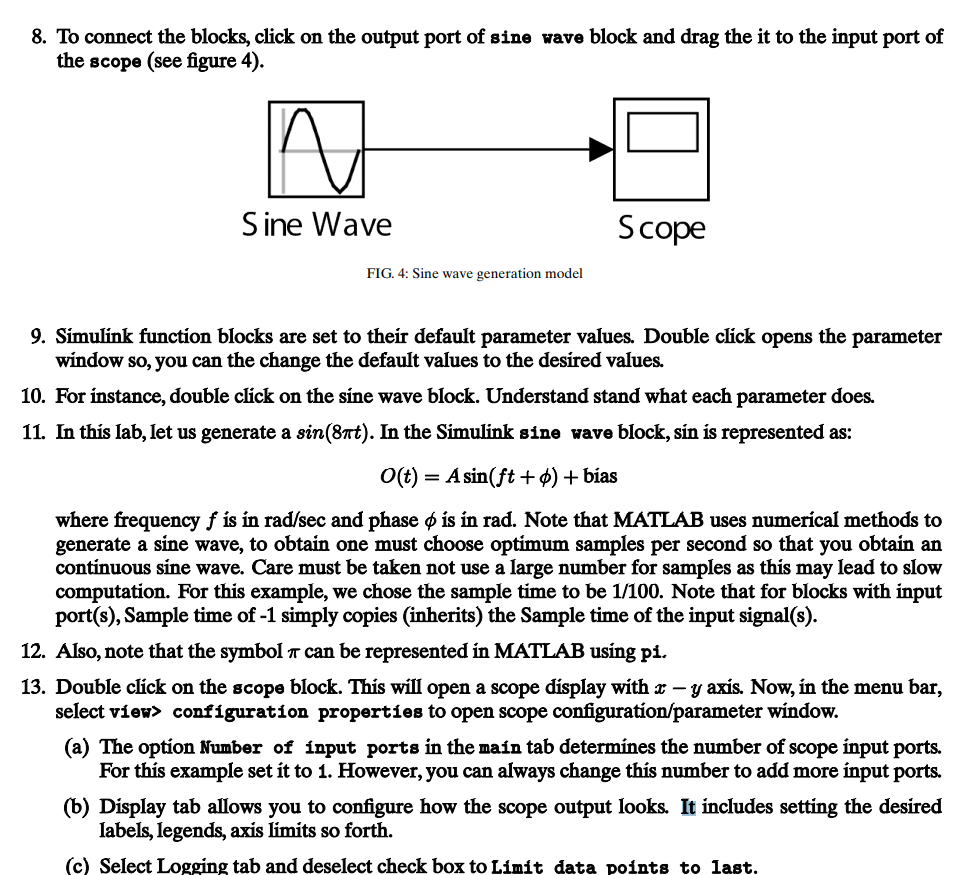
8. To connect the blocks, click on the output port of sine wave block and drag the it to the input port of the scope (see figure 4). IN Sine Wave Scope FIG. 4: Sine wave generation model 9. Simulink function blocks are set to their default parameter values. Double click opens the parameter window so, you can the change the default values to the desired values. 10. For instance, double click on the sine wave block. Understand stand what each parameter does. 11. In this lab, let us generate a sin(8nt). In the Simulink sine wave block, sin is represented as: o(t) = = A sin(ft+) + bias where frequency f is in rad/sec and phase o is in rad. Note that MATLAB uses numerical methods to generate a sine wave, to obtain one must choose optimum samples per second so that you obtain an continuous sine wave. Care must be taken not use a large number for samples as this may lead to slow computation. For this example, we chose the sample time to be 1/100. Note that for blocks with input port(s), Sample time of -1 simply copies (inherits) the Sample time of the input signal(s). 12. Also, note that the symbol i can be represented in MATLAB using pi. 13. Double click on the scope block. This will open a scope display with x - y axis. Now, in the menu bar, select view> configuration properties to open scope configuration/parameter window. (a) The option Number of input ports in the main tab determines the number of scope input ports. For this example set it to 1. However, you can always change this number to add more input ports. (b) Display tab allows you to configure how the scope output looks. It includes setting the desired labels, legends, axis limits so forth. (c) Select Logging tab and deselect check box to Limit data points to last. 8. To connect the blocks, click on the output port of sine wave block and drag the it to the input port of the scope (see figure 4). IN Sine Wave Scope FIG. 4: Sine wave generation model 9. Simulink function blocks are set to their default parameter values. Double click opens the parameter window so, you can the change the default values to the desired values. 10. For instance, double click on the sine wave block. Understand stand what each parameter does. 11. In this lab, let us generate a sin(8nt). In the Simulink sine wave block, sin is represented as: o(t) = = A sin(ft+) + bias where frequency f is in rad/sec and phase o is in rad. Note that MATLAB uses numerical methods to generate a sine wave, to obtain one must choose optimum samples per second so that you obtain an continuous sine wave. Care must be taken not use a large number for samples as this may lead to slow computation. For this example, we chose the sample time to be 1/100. Note that for blocks with input port(s), Sample time of -1 simply copies (inherits) the Sample time of the input signal(s). 12. Also, note that the symbol i can be represented in MATLAB using pi. 13. Double click on the scope block. This will open a scope display with x - y axis. Now, in the menu bar, select view> configuration properties to open scope configuration/parameter window. (a) The option Number of input ports in the main tab determines the number of scope input ports. For this example set it to 1. However, you can always change this number to add more input ports. (b) Display tab allows you to configure how the scope output looks. It includes setting the desired labels, legends, axis limits so forth. (c) Select Logging tab and deselect check box to Limit data points to last


