Answered step by step
Verified Expert Solution
Question
1 Approved Answer
please help me code this!!! Objectives: - Analyze a new data set applying tools from previous lessons. - Further develop oritical thinking skills. - Interpret
please help me code this!!! 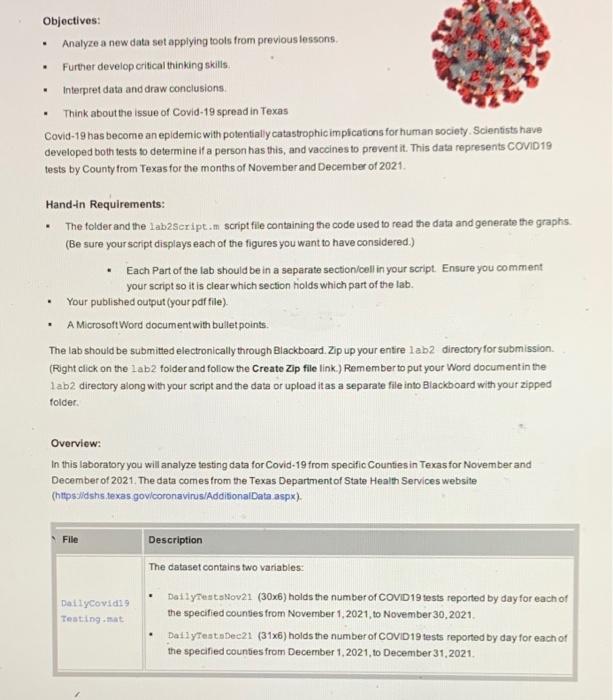
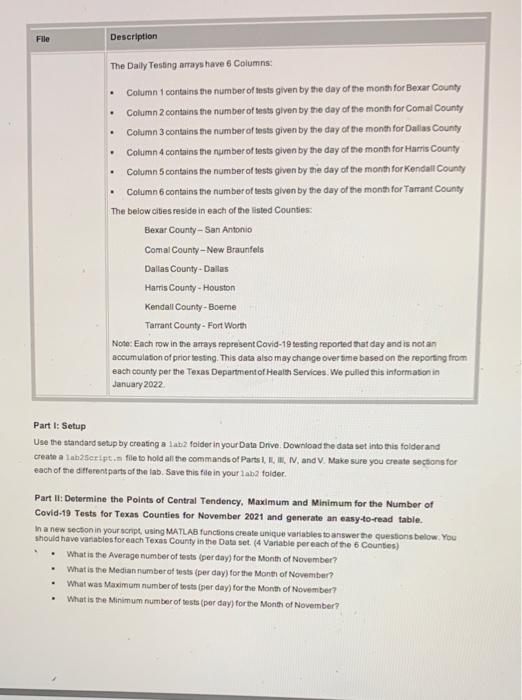
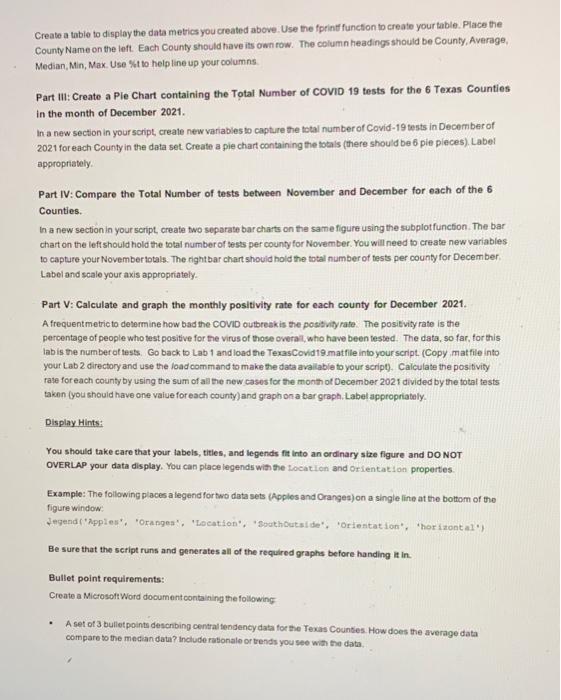
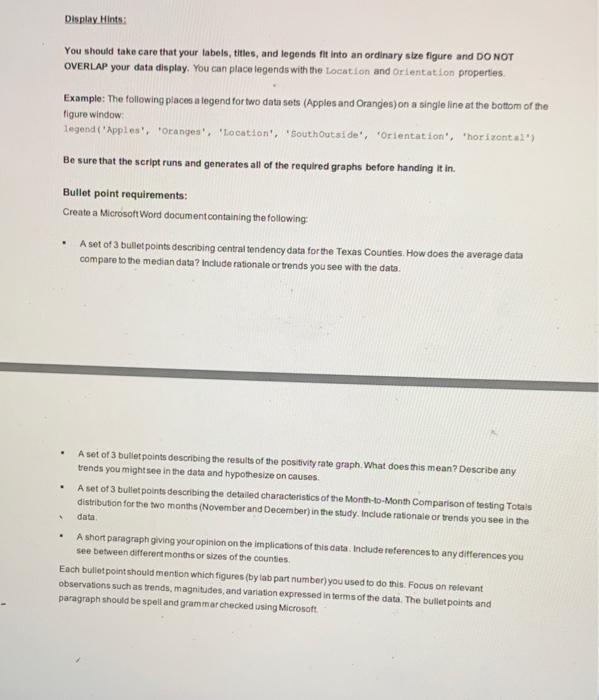
Objectives: - Analyze a new data set applying tools from previous lessons. - Further develop oritical thinking skills. - Interpret data and draw conclusions. - Think about the issue of Covid-19 spread in Texas Covid-19 has become an epidemic with potentialiy catastrophic implications for human society. Scientists have developed both tests to determine if a person has this, and vaccines to prevent it. This data represents COVDD 19 tests by County from Texas for the months of November and December of 2021. Hand-in Requirements: - The tolder and the lab2seript.im script file containing the code used to read the data and generate the graphs. (Be sure your script displays each of the figures you want to have considered.) - Each Part of the lab should be in a separate section/cell in your script. Ensure you comment your script so it is clear which section holds which part of the lab. - Your published output (your paf file). - A MicrosoftWord document with bulletpoints. The lab should be submitted electronically through Blackboard. Zip up your entre lab2 directory for submission. (Rught click on the lab2 folder and follow the Create Zip file link.) Remember to put your Word document in the 1 ab. directory along with your script and the date or upload itas a separate file into Blackboard with your zipped folder. Overviow: In this laboratory you will analyze testing data for Covid-19 from specific Counties in Texas for November and December of 2021 . The data comes from the Texas Department of State Health Services website (httpswidshs texas govicoronavirus/AdditionalData aspx). File Description The Dally Testing arrays have 6 Columns: - Column 1 contains the number of lests given by the day of the month for Bexar County - Column 2 contains the number of tasts given by the day of the month for Comal County - Column 3 contains the number of tests given by the day of the month for Dallas County - Column 4 contains the nymber of tests given by the day of the month for Harris County. - Column 5 contains the number of tests given by the dity of the month for Kendall County - Column 6 contains the number of tests given by the day of the month for Tarrant County The below cites reside in each of the listed Counties: Bexar County - San Antonio Comai County-New Braunfels Dallas County- Dalles Harris County-Houston Kendall County-Boeme Tarrant County- Fort Worth Note: Each row in the artays represent Covid-19 testing reported that day and is not an accumulation of prior lesting. This data also may change over time based on the reporting from each county per the Texas Department of Healst Services. We pulled this informabion in January 2022. Part l: Setup Use the standard setup by creating a labi. folder in your Data. Drive. Download the daka set into this foldior and create a lab2script, nitie to hold all the comm ands of Parts1, E. it., N, and V. Make sure you create soctions for each of the differentparts of the lab. Save this file in your labe folder. Part II: Determine the Polnts of Central Tendency, Maximum and Minimum for the Number of Covid-19 Tests for Texas Counties for November 2021 and generate an easy to-read table. In a new section in your script, using MUATLAB functons create unique variables to answer the questions below, You should have variablesforeach Texas County in the Data set. (4 Variable pereach of the 6 Countes) - What is the Average number of tests (perday) for the Month of November? - What is the Median number of tests (per day) for the Month of November? - What was Maximum nurbber of tests (per day) for the Month of November? - What is the Minimum number of tests (por day) for the Month of November? Create a table to disploy the data metrics you created above. Use the fprintf function to create your table. Place the County Name on the left. Each County should have its own row. The column headings should be County, Average, Median, Min, Max. Use \%t to help line up your columns. Part III: Create a Ple Chart containing the Total Number of COVID 19 tests for the 6 Texas Counties in the month of December 2021. In a new section in your script, create new variables to capture the total number of Covid-19 tests in December of 2021 for each County in the data set. Create a pie chart containing the totals (there shou'd be 6 pie pleces). Label appropriately. Part IV: Compare the Total Number of tests between November and December for each of the 6 Counties. In a new section in your script, create two separate bar charts on the same figure using the subplotfunction. The bar chart on the leff should hold the total number of tests per county for November. You will need to create new variables. to capture your November totals. The rightbar chart should hold the total number of tests per county for December. Label and scale your axis appropriately. Part V: Calculate and graph the monthly positivity rate for each county for December 2021. A frequentmetric to determine how bad the COVID outbreakis the positiviyrate. The positvity rate is the percentage of people who test positive for the virus of those overal, who have been tested. The data, so far, tor this lab is the number of lests. Go back to Lab 1 and load the Texas Covid19 matfile into your script. (Copy mat file into your Lab 2 directory and use the load command to make the data avallable byour script). Calculate the positivity rate for each county by using the sum of al the new casesfor the month of December 2021 divided by the total tests taknn (you should have one vaiue for each county) and graph on a bar graph, Label appropriately. Display Hints: You should take care that your labels, tities, and legends fit into an ordinary size figure and DO NOT OVERLAP your data display. You can place legends with the Location and Orientation properties. Example: The following places a legend fortwo data sets (Apples and Oranges) on a single line at the bottom of the figure window: Jegend ('Apples', 'Orangea', 'Location", "Southoutside', 'Orlestation", 'horiantal") Be sure that the script runs and generates all of the required graphs before handing it in. Bullet point requirements: Create a Mictosoft Word document containing the following - A set of 3 bulletpoint describing central tendency data for the Texas Counties. How does the average data compare to the median data? include rabionale or trends you see with the date. Display Hints: You should take care that your labels, titles, and legends fit into an ordinary size figure arid DO NOT OVERLAP your data display. You can place legends with the Location and Orienitat lon properties. Example: The following places a fegend for ko datn sets (Apples and Oranges) on a single line at the bottorm of the: figure window: legend ('Apples', 'Oranges', "tocation', "Southoutside', 'Orientation", "horizont al") Be sure that the script runs and generates all of the required graphs before handing it in. Bullet point requirements: Create a Microsoft Word document containing the following: - A set of 3 buletpoints describing central tendency data for the Texas Counties. How does the average data compare to the median data? Include rationale or trends you see with the data. - A set of 3 butiletpoints describing the results of the positivity rate graph. What does this mean? Describe any trends youmightsee in the data and hypothesize on causes. - A set of 3 bulletpoints describing the detailed characteristics of the Month-to-Month Comparison of testing Totals distribution for the two months (November and December) in the study. Incluce ratonale or trends you see in the data. - A short paragraph giving your opinion on the implicabons of this data . Include references to any differences you see between differertmonths or sizes of the countles. Each buliet point should mention which figures (by lab part number) you used to do this. Focus on relovant observations such as trends, magnitudes, and variation expressed in terms of the data. The bulletpoints and paragraph should be spell and grammar checked using Microsoft 


Step by Step Solution
There are 3 Steps involved in it
Step: 1

Get Instant Access to Expert-Tailored Solutions
See step-by-step solutions with expert insights and AI powered tools for academic success
Step: 2

Step: 3

Ace Your Homework with AI
Get the answers you need in no time with our AI-driven, step-by-step assistance
Get Started


