Please help me code this!!

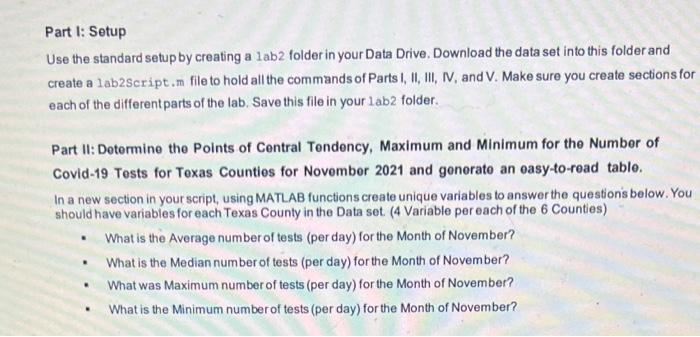
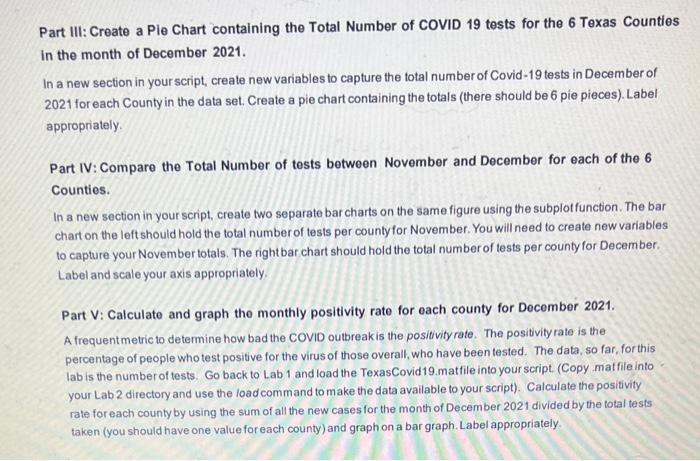
Part I: Setup Use the standard setup by creating a 1 ab2 folder in your Data Drive. Download the data set into this folder and create a lab2Script.m file to hold all the commands of Parts I, II, III, IV, and V. Make sure you create sections for each of the different parts of the lab. Save this file in your 1ab2 folder. Part II: Determine the Points of Central Tendency, Maximum and Minimum for the Number of Covid-19 Tests for Texas Counties for November 2021 and generate an easy-to-read table. In a new section in your script, using MATLAB functions create unique variables to answer the questions below. You should have variables for each Texas County in the Data set. (4 Variable per each of the 6 Counties) - What is the Average number of tests (per day) for the Month of November? - What is the Median number of tests (per day) for the Month of November? - What was Maximum number of tests (per day) for the Month of November? - What is the Minimum number of tests (per day) for the Month of November? in the month of December 2021. In a new section in your script, create new variables to capture the total number of Covid-19 tests in December of 2021 for each County in the data set. Create a pie chart containing the totals (there should be 6 pie pieces). Label appropriately. Part IV: Compare the Total Number of tests between November and December for each of the 6 Countios. In a new section in your script, create two separate bar charts on the same figure using the subplotfunction. The bar chart on the left should hold the total number of tests per county for November. You will need to create new variables to capture your November totals. The right bar chart should hold the total number of tests per county for December. Label and scale your axis appropriately. Part V: Calculate and graph the monthly positivity rate for each county for December 2021. A frequentmetric to determine how bad the COVID outbreakis the positivity rate. The positivity rate is the percentage of people who test positive for the virus of those overall, who have been tested. The data, so far, for this lab is the number of tests. Go back to Lab 1 and load the TexasCovid19.matfile into your script. (Copy matfile into your Lab 2 directory and use the load comm and to make the data available to your script). Calculate the positivity rate for each county by using the sum of all the new cases for the month of December 2021 divided by the total tests taken (you should have one value for each county) and graph on a bar graph. Label appropriately


