Please help me come up with some commentary to make on the horizontal analysis and vertical analysis of Go Pro's income statement. - Major observations
Please help me come up with some commentary to make on the horizontal analysis and vertical analysis of Go Pro's income statement.
- Major observations about the income statements
-explain what jumps out to you & implications of that
-How this statement can cause someone to recommend not to invest into the company.
-Bad decisions that are being made?
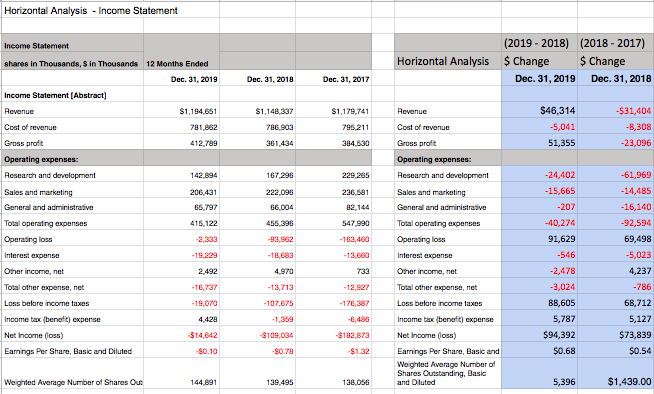
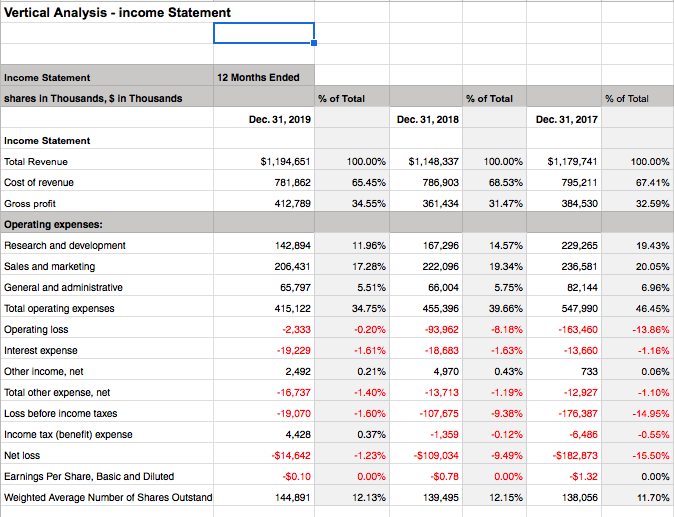
Horizontal Analysis - Income Statement Income Statement Horizontal Analysis (2019-2018) (2018 - 2017) Change Change Dec. 31, 2019 Dec. 31, 2018 Dec. 31, 2019 Dec 31, 2018 Dec. 31, 2017 $1,194,651 781,862 412,789 $1,148,337 786.902 361,434 $1,179,741 795,211 384,530 $46,314 -5,041 51,355 - $31,404 -8,308 -23,096 Income Statement (Abstract) Revenue Cost of revenue Gross profit Operating expenses Research and development Sales and marketing General and administrative Total operating expenses Operating loss Interest expense Other income, net Total other expense, net Loss before income taxes Income tax (benefit) expense Net Income (loss) Earnings Per Share, Basic and Diluted 167,296 222,096 66.004 455,396 -93,962 -18,683 4,970 -13.713 -107,675 229.265 236,581 82.144 547,990 -163,460 142,894 206.431 65.797 415.122 -2,333 -19,229 2.492 -16,737 - 19,070 4,428 $14,642 $0.10 Revenue Cost of revenue Gross profit Operating expenses: Research and development Sales and marketing General and administrative Total operating expenses Operating loss Interest expense Other income, net Total other expense, net Loss before income taxes Income tax (benefit) expense Net Income (loss) Earnings Per Share, Basic and Weighted Average Number of Shares Outstanding. Basic and Dluted -24,402 -15,665 -207 -40,274 91,629 -546 -61,969 -14,485 -16,140 -92,594 69,498 -5,023 4,237 -786 68,712 5,127 $73,839 $0.54 -2,478 -176,387 -3,024 88,605 5,787 $94,392 $0.68 -6,486 $182,873 $1.32 $109,034 $0.78 Weighted Average Number of Shares Out 144,891 139,495 138,056 5,396 $1,439.00 Vertical Analysis - income Statement 12 Months Ended Income Statement shares in Thousands, $ in Thousands % of Total % of Total % of Total Dec. 31, 2019 Dec. 31, 2018 Dec. 31, 2017 Income Statement Total Revenue 100.00% $1,179,741 Cost of revenue $1,194,651 781,862 412,789 65.45% 34.55% $1,148,337 786,903 361,434 100.00% 68.53% 31.47% 795,211 384,530 100.00% 67.41% 32.59% Gross profit Operating expenses: Research and development 229.265 19.43% 236,581 11.96% 17.28% 5.51% Sales and marketing General and administrative 20.05% 142,894 206,431 65,797 415,122 -2,333 167.296 222.096 66,004 455,396 -93,962 14.57% 19.34% 5.75% 39.66% -8.18% 6.96% 34.75% 46.45% 82,144 547,990 -163,460 -13,660 -0.20% Total operating expenses Operating loss Interest expense Other income, net -13.86% -19,229 -1.61% -18,683 -1.63% -1.16% 2,492 0.21% 4,970 0.43% 733 0.06% Total other expense, net - 16,737 -1.40% -13,713 - 1.19% -12,927 -1.10% Loss before income taxes -19,070 -1.60% - 107,675 -9.38% -176,387 -14.95% Income tax (benefit) expense 4,428 0.37% -1,359 -0.12% -6,486 -0.55% Net loss -$14,642 -1.23% -$109,034 -9.49% $182,873 -15.50% -$0.10 -$0.78 Earnings Per Share, Basic and Diluted Weighted Average Number of Shares Outstand 0.00% 12.13% 0.00% 12.15% $1.32 138,056 0.00% 11.70% 144,891 139,495