Please help me compute some comparative data between these three years of financial information.

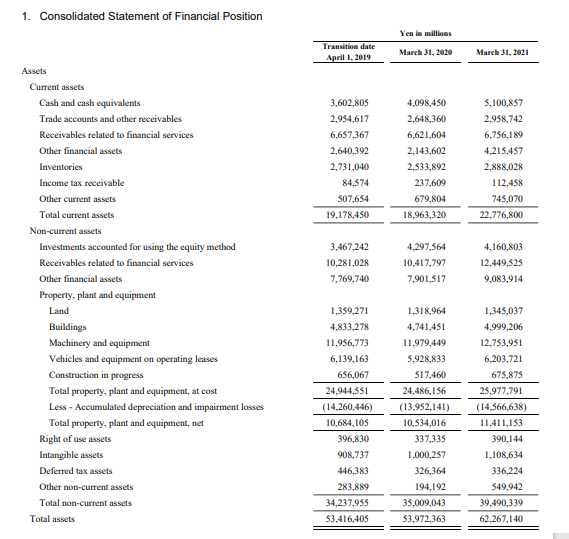
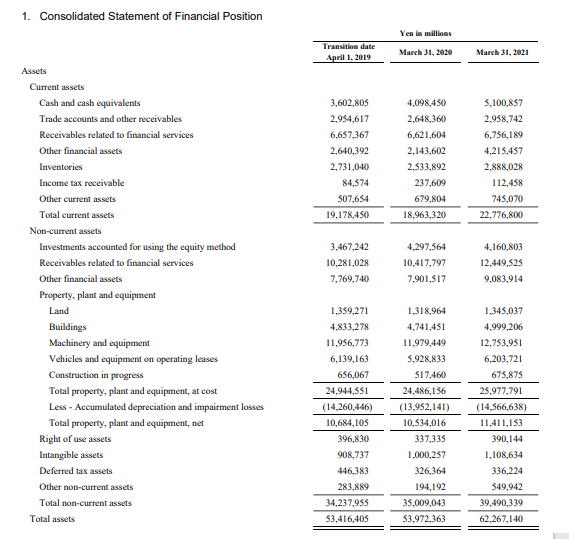
1. Consolidated Statement of Financial Position Yen in millions Transition date April 1. 2019 March 31, 2020 March 31, 2021 Assets 3,602,805 2,954,617 6,657,367 2,640,392 2,731,040 84,574 507,654 19,178,450 4,098,450 2.648,360 6.621,604 2,143,602 2.533,892 237,609 679,804 18.963,320 5,100,857 2.958,742 6,756,189 4,215,457 2.888,028 112,458 745,070 22,776,800 3,467,242 10,281,028 7.769,740 4,297,564 10,417,797 7.901,517 4,160,803 12,449,525 9.083,914 Current assets Cash and cash equivalents Trade accounts and other receivables Receivables related to financial services Other financial assets Inventories Income tax receivable Other current assets Total current assets Non-current assets Investments accounted for using the equity method Receivables related to financial services Other financial assets Property, plant and equipment Land Buildings Machinery and equipment Vehicles and equipment on operating leases Construction in progress Total property, plant and equipment, at cost Less - Accumulated depreciation and impairment losses Total property, plant and equipment, net Right of use assets Intangible assets Deferred tax assets Other non-current assets Total non-current assets Total assets 1,359,271 4.833,278 11,956,773 6,139,163 656,067 24,944,551 (14,260,446) 10,684,105 396,830 908,737 446,383 283,889 34,237,955 53,416,405 1.318,964 4.741,451 11.979,449 5.928,833 517,460 24.486,156 (13,952.141) 10,534,016 337,335 1.000,257 326,364 194,192 35,009,043 53.972.363 1.345,037 4.999,206 12,753,951 6.203,721 675,875 25.977,791 (14,566,638) 11,411,153 390,144 1,108,634 336,224 549,942 39.490,339 62,267,140 1. Consolidated Statement of Financial Position Yen in millions Transition date April 1. 2019 March 31, 2020 March 31, 2021 Assets 3,602,805 2,954,617 6,657,367 2,640,392 2,731,040 84,574 507,654 19,178,450 4,098,450 2.648,360 6.621,604 2,143,602 2.533,892 237,609 679,804 18.963,320 5,100,857 2.958,742 6,756,189 4,215,457 2.888,028 112,458 745,070 22,776,800 3,467,242 10,281,028 7.769,740 4,297,564 10,417,797 7.901,517 4,160,803 12,449,525 9.083,914 Current assets Cash and cash equivalents Trade accounts and other receivables Receivables related to financial services Other financial assets Inventories Income tax receivable Other current assets Total current assets Non-current assets Investments accounted for using the equity method Receivables related to financial services Other financial assets Property, plant and equipment Land Buildings Machinery and equipment Vehicles and equipment on operating leases Construction in progress Total property, plant and equipment, at cost Less - Accumulated depreciation and impairment losses Total property, plant and equipment, net Right of use assets Intangible assets Deferred tax assets Other non-current assets Total non-current assets Total assets 1,359,271 4.833,278 11,956,773 6,139,163 656,067 24,944,551 (14,260,446) 10,684,105 396,830 908,737 446,383 283,889 34,237,955 53,416,405 1.318,964 4.741,451 11.979,449 5.928,833 517,460 24.486,156 (13,952.141) 10,534,016 337,335 1.000,257 326,364 194,192 35,009,043 53.972.363 1.345,037 4.999,206 12,753,951 6.203,721 675,875 25.977,791 (14,566,638) 11,411,153 390,144 1,108,634 336,224 549,942 39.490,339 62,267,140 1. Consolidated Statement of Financial Position Yen in millions Transition date April 1. 2019 March 31, 2020 March 31, 2021 Assets 3,602,805 2,954,617 6,657,367 2,640,392 2,731,040 84,574 507,654 19,178,450 4,098,450 2.648,360 6.621,604 2,143,602 2.533,892 237,609 679,804 18.963,320 5,100,857 2.958,742 6,756,189 4,215,457 2.888,028 112,458 745,070 22,776,800 3,467,242 10,281,028 7.769,740 4,297,564 10,417,797 7.901,517 4,160,803 12,449,525 9.083,914 Current assets Cash and cash equivalents Trade accounts and other receivables Receivables related to financial services Other financial assets Inventories Income tax receivable Other current assets Total current assets Non-current assets Investments accounted for using the equity method Receivables related to financial services Other financial assets Property, plant and equipment Land Buildings Machinery and equipment Vehicles and equipment on operating leases Construction in progress Total property, plant and equipment, at cost Less - Accumulated depreciation and impairment losses Total property, plant and equipment, net Right of use assets Intangible assets Deferred tax assets Other non-current assets Total non-current assets Total assets 1,359,271 4.833,278 11,956,773 6,139,163 656,067 24,944,551 (14,260,446) 10,684,105 396,830 908,737 446,383 283,889 34,237,955 53,416,405 1.318,964 4.741,451 11.979,449 5.928,833 517,460 24.486,156 (13,952.141) 10,534,016 337,335 1.000,257 326,364 194,192 35,009,043 53.972.363 1.345,037 4.999,206 12,753,951 6.203,721 675,875 25.977,791 (14,566,638) 11,411,153 390,144 1,108,634 336,224 549,942 39.490,339 62,267,140 1. Consolidated Statement of Financial Position Yen in millions Transition date April 1. 2019 March 31, 2020 March 31, 2021 Assets 3,602,805 2,954,617 6,657,367 2,640,392 2,731,040 84,574 507,654 19,178,450 4,098,450 2.648,360 6.621,604 2,143,602 2.533,892 237,609 679,804 18.963,320 5,100,857 2.958,742 6,756,189 4,215,457 2.888,028 112,458 745,070 22,776,800 3,467,242 10,281,028 7.769,740 4,297,564 10,417,797 7.901,517 4,160,803 12,449,525 9.083,914 Current assets Cash and cash equivalents Trade accounts and other receivables Receivables related to financial services Other financial assets Inventories Income tax receivable Other current assets Total current assets Non-current assets Investments accounted for using the equity method Receivables related to financial services Other financial assets Property, plant and equipment Land Buildings Machinery and equipment Vehicles and equipment on operating leases Construction in progress Total property, plant and equipment, at cost Less - Accumulated depreciation and impairment losses Total property, plant and equipment, net Right of use assets Intangible assets Deferred tax assets Other non-current assets Total non-current assets Total assets 1,359,271 4.833,278 11,956,773 6,139,163 656,067 24,944,551 (14,260,446) 10,684,105 396,830 908,737 446,383 283,889 34,237,955 53,416,405 1.318,964 4.741,451 11.979,449 5.928,833 517,460 24.486,156 (13,952.141) 10,534,016 337,335 1.000,257 326,364 194,192 35,009,043 53.972.363 1.345,037 4.999,206 12,753,951 6.203,721 675,875 25.977,791 (14,566,638) 11,411,153 390,144 1,108,634 336,224 549,942 39.490,339 62,267,140


