Question
Please help me!! Do Google searchfor 'Largest GDPdrops in U.S History' and compare the two articles below. Answer questions - How did the mid-May preliminarypredictionsactually
Please help me!!
Do Google searchfor'Largest GDPdrops in U.S History' and compare the two articles below.
Answer questions -
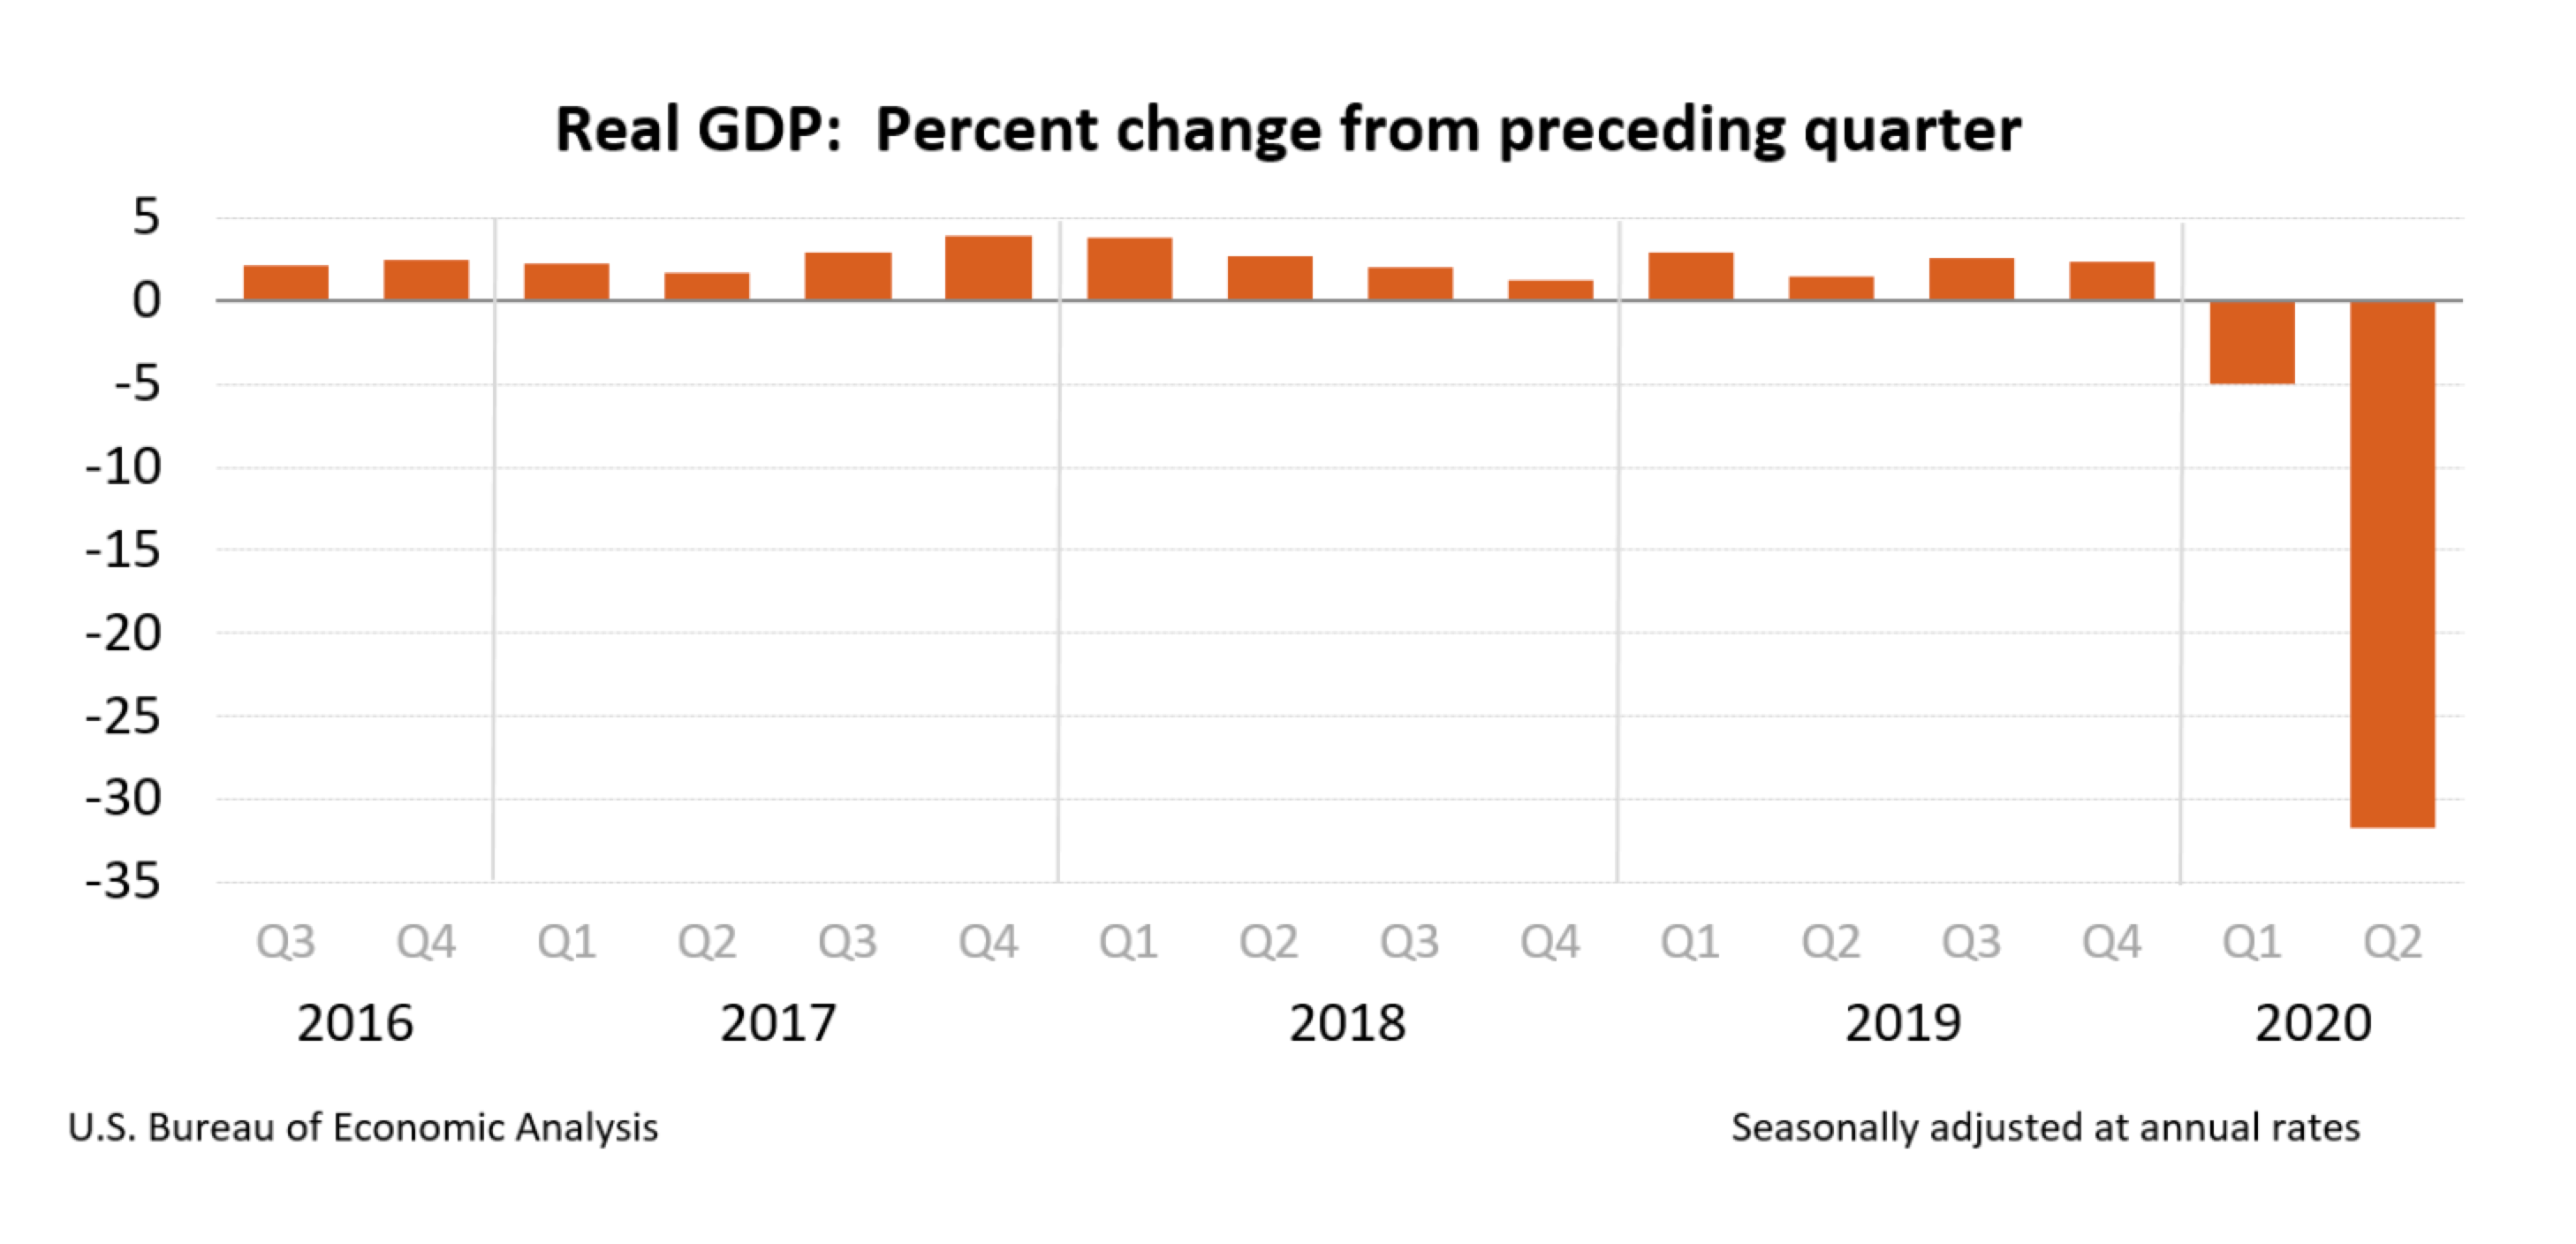
- How did the mid-May preliminarypredictionsactually compare with the information in the July 30 news release?
- What do youthink makes this drop in GDPso much larger than any previously recorded?
Article 1:
Gross domestic product, which tallies the sum of goods and services across the economy, is on track to crater 42.8% in the April-to-June period, according to a running measure kept by the Atlanta Federal Reserve.
The tracker, called GDPNow, had been indicating a drop of 34.9% a week ago, but a raft of poor economic data since then caused the central bank district to take down the figure even more. The drop would easily be the worst in the post-World War II era.
On top of all the bad jobs reports recently, the Census Bureau reported Friday thatretail sales collapsed 16.4% in April, which was even worse than the 12.3% that economists surveyed by Dow Jones had been forecasting. That came following news Thursday that another nearly3 million Americans filed jobless claimslast week, bringing the running eight-week total during the coronavirus lockdown to 36.5 million.
Economic reports in general have been running lower than even the sharply reduced expectations. The Citigroup Economic Surprise Index, which gauges the data against Wall Street estimates, hit its lowest-ever point at the end of April in records that go back to January 2003.
Taking the data together, the Atlanta Fed now sees personal consumption expenditures, which make 68% of GDP, falling by 43.6% in Q2, down from the May 8 estimate of -33.9%. Gross private domestic investment, which currently is 17% of GDP, is expected to plunge by 69.4%, down from a -62.8% estimate a week ago.
GDPNow can be volatile and is not a forecast per se but rather a running estimate based on real-time data. However, it is only somewhat worse than other prominent estimates.
Goldman Sachs, for instance, recently projected growth to fall 39% for the quarter. The firm, though, sees a big bounce on the other side, with Q3 rising 29%. The New York Fed's GDP Nowcast is tracking at 31.05%.
Article 2:
Real gross domestic product(GDP) decreased at an annual rate of 31.7 percent in the second quarter of 2020 (table 1), according to the "second" estimate released by the Bureau of Economic Analysis. In the first quarter, real GDP decreased 5.0 percent.
The GDP estimate released today is based on more complete source data than were available for the "advance" estimate issued last month. In the advance estimate, the decrease in real GDP was 32.9 percent. With the second estimate, private inventory investment and personal consumption expenditures (PCE) decreased less than previously estimated.(see "Updates to GDP" on page 2).
Coronavirus (COVID-19) Impact on the Second-Quarter 2020 GDP Estimate
The decline in second quarter GDP reflected the response to COVID-19, as "stay-at-home" orders issued in March and April were partially lifted in some areas of the country in May and June, and government pandemic assistance payments were distributed to households and businesses. This led to rapid shifts in activity, as businesses and schools continued remote work and consumers and businesses canceled, restricted, or redirected their spending. The full economic effects of the COVID-19 pandemic cannot be quantified in the GDP estimate for the second quarter of 2020 because the impacts are generally embedded in source data and cannot be separately identified.

Step by Step Solution
There are 3 Steps involved in it
Step: 1

Get Instant Access to Expert-Tailored Solutions
See step-by-step solutions with expert insights and AI powered tools for academic success
Step: 2

Step: 3

Ace Your Homework with AI
Get the answers you need in no time with our AI-driven, step-by-step assistance
Get Started


