Please help me do these:
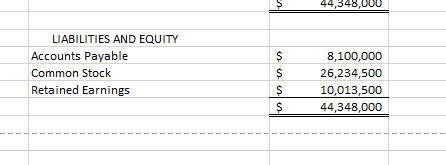
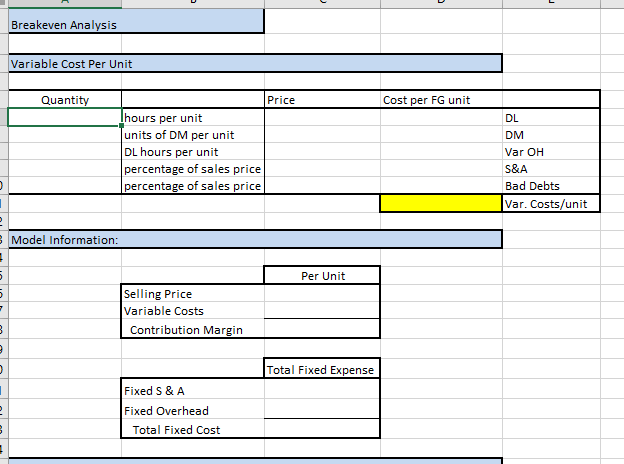
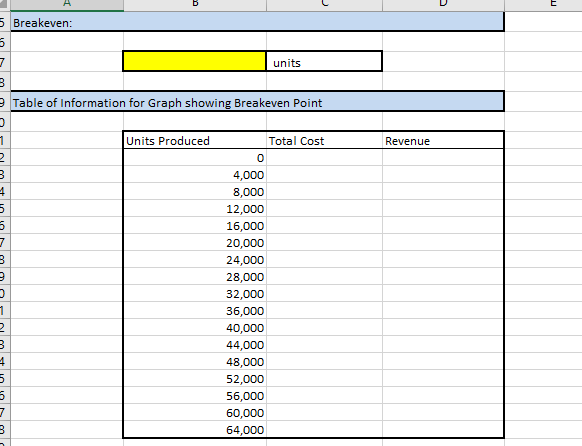
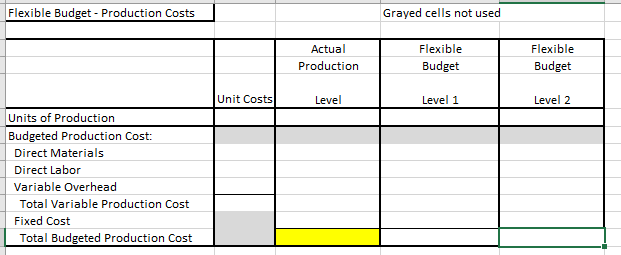
G) breakeven analysis: 1. breakeven sales level in units and dollars. 2. cost volume profit graph showing the breakeven point H) Flexible Budget 1. Create the flexible budget results for production costs as if actual production were 160,000 units in the first quarter of 2019 2. Add flexible budget results for slightly higher and slightly lower production at 170,000 units and 150,000 units, respectively. Here are the numbers:
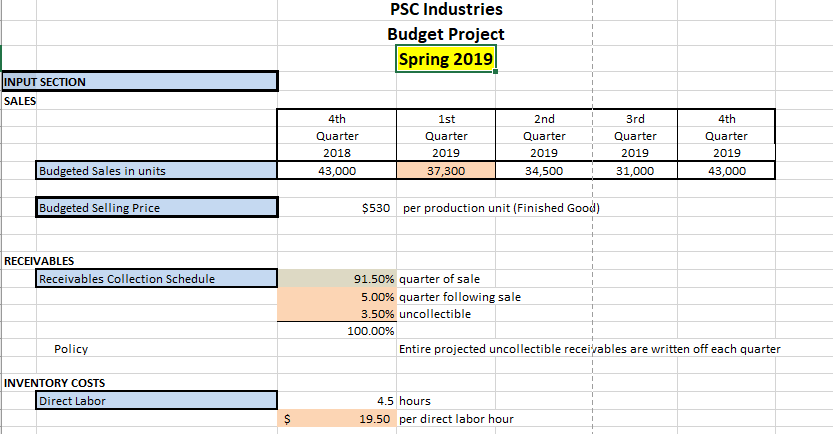
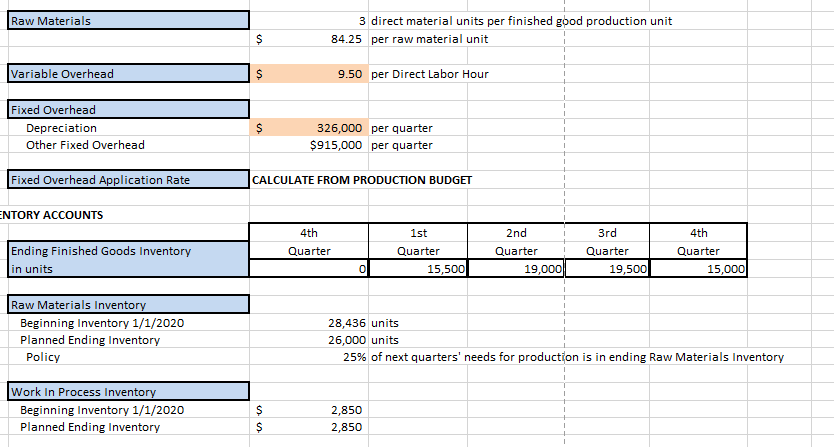
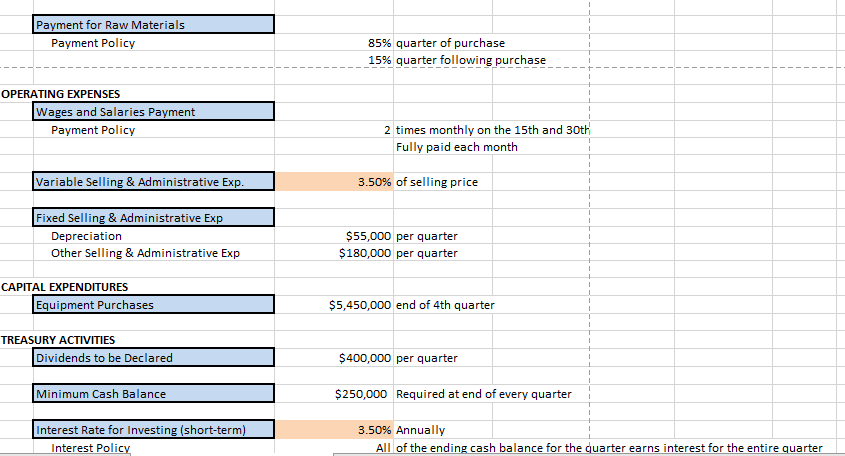
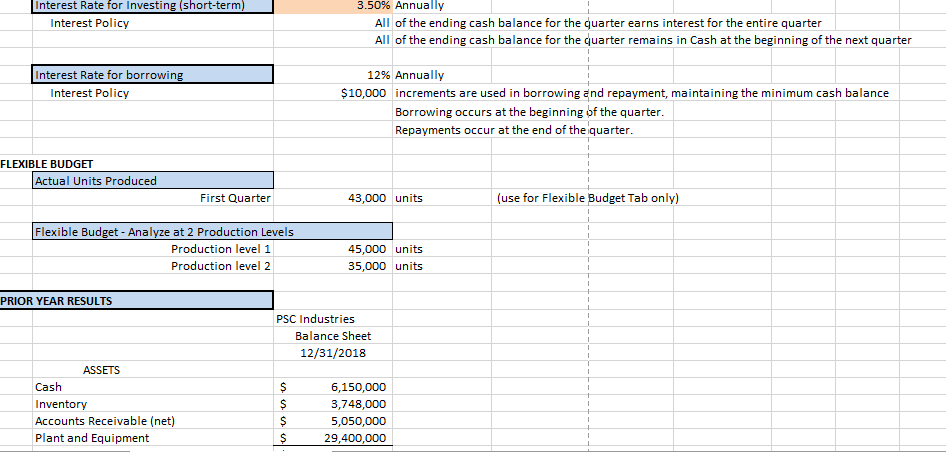
Here are the numbers:
Here is break even template
Flexible budget templates
PSC Industries Budget Project Spring 2019 INPUT SECTION SALES 2nd QuarterQuarter 4th Quarter 2018 43,000 1st Quarter 2019 37,300 4th Quarter 2019 43,000 2019 2019 Budgeted Sales in units 34,500 31,000 Budgeted Selling Price $530 per production unit (Finished Good) RECEIVABLES Receivables Collection Schedule 91.50% quarter of sale 5.00% quarter following sale 3.50% uncollectible 100.00% Policy Entire projected uncollectible receivables are written off each quarter INVENTORY COSTS Direct Labor 4.5 hours 19.50 per direct labor hour Raw Materials 3 direct material units per finished good production unit 84.25 per raw material unit Variable Overhead 9.50 per Direct Labor Hour Fixed Overhead Depreciation Other Fixed Overhead 326,000 per quarter $915,000 per quarter Fixed Overhead Application Rate CALCULATE FROM PRODUCTION BUDGET NTORY ACCOUNTS 4th 2nd Quarter 4th 1st Quarter Ending Finished Goods Inventory in units Quarter Quarter Quarter 0 15,500 19,000 19,500 15,000 Raw Materials Inventor Beginning Inventory 1/1/2020 Planned Ending Inventory 28,436 units 26,000 units Policy 25% of next quarters' needs for production is in ending Raw Materials Inventory Work In Process Inventory Beginning Inventory 1/1/2020 Planned Ending Inventory 2,850 2,850 Interest Rate for Investing (short-term) 3.50% Annually Interest Policy All of the ending cash balance for the quarter earns interest for the entire quarter All of the ending cash balance for the quarter remains in Cash at the beginning of the next quarter Interest Rate for borrowing 12% Annually Interest Policy $10,000 increments are used in borrowing and repayment, maintaining the minimum cash balance Borrowing occurs at the beginning of the quarter Repayments occur at the end of the iquarter FLEXIBLE BUDGET Actual Units Produced First Quarter 43,000 units (use for Flexible Budget Tab only) Flexible Budget - Analyze at 2 Production Levels Production level 1 Production level 2 45,000 units 35,000 units PRIOR YEAR RESULTS PSC Industries Balance Sheet 12/31/2018 ASSETS Cash Inventory Accounts Receivable (net) Plant and Equipment 6,150,000 3,748,000 5,050,000 29,400,000 LIABILITIES AND EQUITY Accounts Payable Common Stock Retained Earnings 8,100,000 26,234,500 $ 10,013,500 44,348,000 Breakeven Analysis Variable Cost Per Unit Quantity trie hours per unit units of DM per unit DL hours per unit percentage of sales price percentage of sales price DL DM Var OH S&A Bad Debts Var. Costs/unit Model Information Per Unit Selling Price Variable Costs Contribution Margin Total Fixed Expense Fixed S & A Fixed Overhead Total Fixed Cost 5 Breakeven: units 9Table of Information for Graph showing Breakeven Point Total Cost Revenue 0 4,000 .XX) 12,000 16,000 20,000 28,000 32,000 36,000 48,000 52,000 56,000 64,000 Flexible Budget Production Costs Grayed cells not used Actual Production Flexible Flexible Budget Budget Unit Costs Level Level 1 Level 2 Budgeted Production Cost: Direct Materials Direct Labor Variable Overhead Total Variable Production Cost Fixed Cost Total Budgeted Production Cost PSC Industries Budget Project Spring 2019 INPUT SECTION SALES 2nd QuarterQuarter 4th Quarter 2018 43,000 1st Quarter 2019 37,300 4th Quarter 2019 43,000 2019 2019 Budgeted Sales in units 34,500 31,000 Budgeted Selling Price $530 per production unit (Finished Good) RECEIVABLES Receivables Collection Schedule 91.50% quarter of sale 5.00% quarter following sale 3.50% uncollectible 100.00% Policy Entire projected uncollectible receivables are written off each quarter INVENTORY COSTS Direct Labor 4.5 hours 19.50 per direct labor hour Raw Materials 3 direct material units per finished good production unit 84.25 per raw material unit Variable Overhead 9.50 per Direct Labor Hour Fixed Overhead Depreciation Other Fixed Overhead 326,000 per quarter $915,000 per quarter Fixed Overhead Application Rate CALCULATE FROM PRODUCTION BUDGET NTORY ACCOUNTS 4th 2nd Quarter 4th 1st Quarter Ending Finished Goods Inventory in units Quarter Quarter Quarter 0 15,500 19,000 19,500 15,000 Raw Materials Inventor Beginning Inventory 1/1/2020 Planned Ending Inventory 28,436 units 26,000 units Policy 25% of next quarters' needs for production is in ending Raw Materials Inventory Work In Process Inventory Beginning Inventory 1/1/2020 Planned Ending Inventory 2,850 2,850 Interest Rate for Investing (short-term) 3.50% Annually Interest Policy All of the ending cash balance for the quarter earns interest for the entire quarter All of the ending cash balance for the quarter remains in Cash at the beginning of the next quarter Interest Rate for borrowing 12% Annually Interest Policy $10,000 increments are used in borrowing and repayment, maintaining the minimum cash balance Borrowing occurs at the beginning of the quarter Repayments occur at the end of the iquarter FLEXIBLE BUDGET Actual Units Produced First Quarter 43,000 units (use for Flexible Budget Tab only) Flexible Budget - Analyze at 2 Production Levels Production level 1 Production level 2 45,000 units 35,000 units PRIOR YEAR RESULTS PSC Industries Balance Sheet 12/31/2018 ASSETS Cash Inventory Accounts Receivable (net) Plant and Equipment 6,150,000 3,748,000 5,050,000 29,400,000 LIABILITIES AND EQUITY Accounts Payable Common Stock Retained Earnings 8,100,000 26,234,500 $ 10,013,500 44,348,000 Breakeven Analysis Variable Cost Per Unit Quantity trie hours per unit units of DM per unit DL hours per unit percentage of sales price percentage of sales price DL DM Var OH S&A Bad Debts Var. Costs/unit Model Information Per Unit Selling Price Variable Costs Contribution Margin Total Fixed Expense Fixed S & A Fixed Overhead Total Fixed Cost 5 Breakeven: units 9Table of Information for Graph showing Breakeven Point Total Cost Revenue 0 4,000 .XX) 12,000 16,000 20,000 28,000 32,000 36,000 48,000 52,000 56,000 64,000 Flexible Budget Production Costs Grayed cells not used Actual Production Flexible Flexible Budget Budget Unit Costs Level Level 1 Level 2 Budgeted Production Cost: Direct Materials Direct Labor Variable Overhead Total Variable Production Cost Fixed Cost Total Budgeted Production Cost


