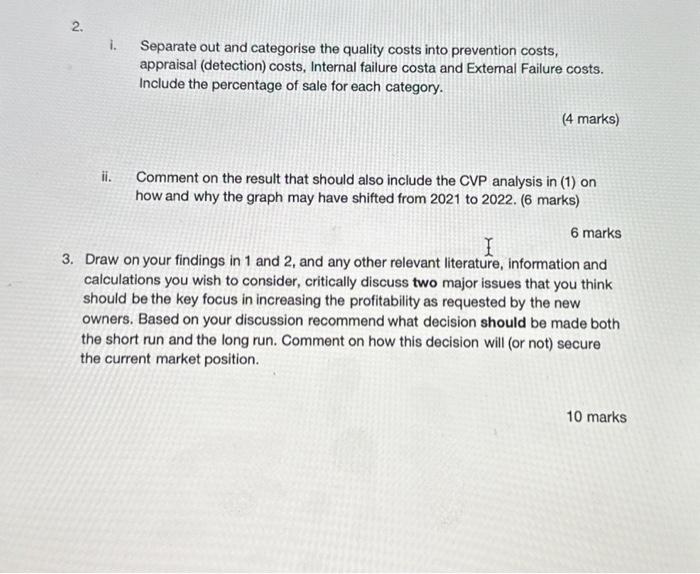
Please help me draw a CVP chart of Hotel Znoor Ltd and answer the Second question Include 2 small question! 2i and 2ii
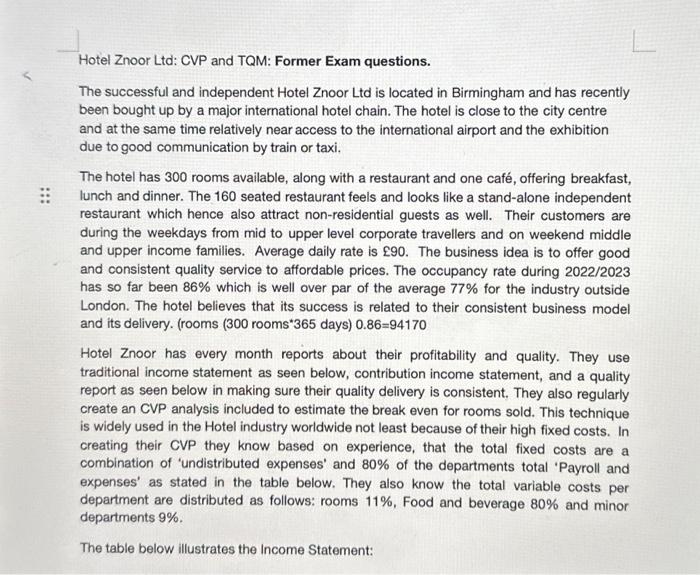
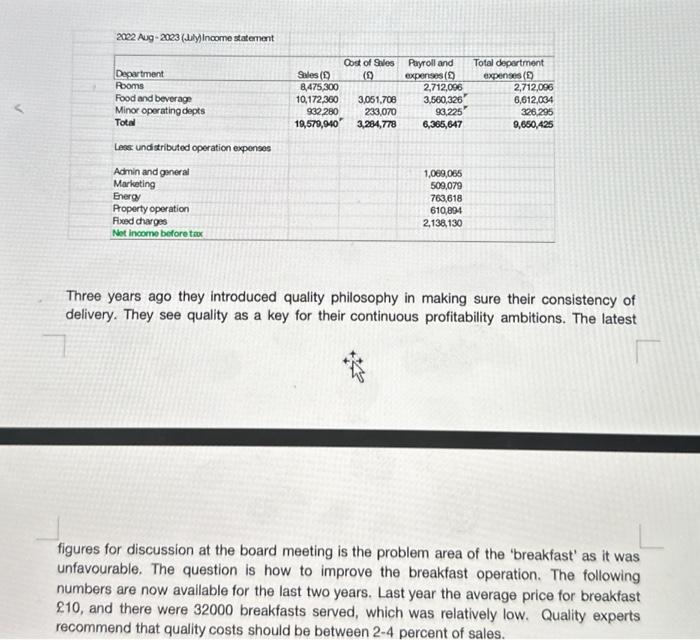
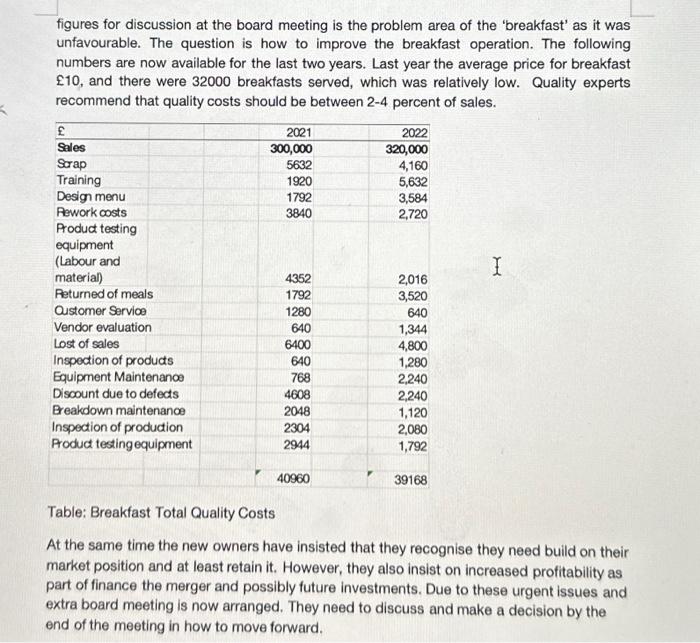
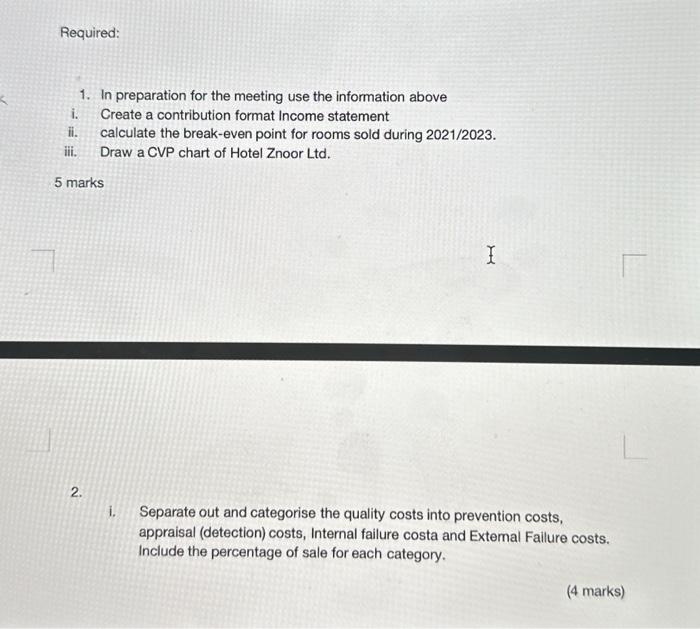
Hotel Znoor Ltd: CVP and TQM: Former Exam questions. The successful and independent Hotel Znoor Ltd is located in Birmingham and has recently been bought up by a major international hotel chain. The hotel is close to the city centre and at the same time relatively near access to the international airport and the exhibition due to good communication by train or taxi. The hotel has 300 rooms available, along with a restaurant and one caf, offering breakfast, lunch and dinner. The 160 seated restaurant feels and looks like a stand-alone independent restaurant which hence also attract non-residential guests as well. Their customers are during the weekdays from mid to upper level corporate travellers and on weekend middle and upper income families. Average daily rate is 90. The business idea is to offer good and consistent quality service to affordable prices. The occupancy rate during 2022/2023 has so far been 86% which is well over par of the average 77% for the industry outside London. The hotel believes that its success is related to their consistent business model and its delivery. (rooms ( 300 rooms 365 days) 0.86=94170 Hotel Znoor has every month reports about their profitability and quality. They use traditional income statement as seen below, contribution income statement, and a quality report as seen below in making sure their quality delivery is consistent. They also regularly create an CVP analysis included to estimate the break even for rooms sold. This technique is widely used in the Hotel industry worldwide not least because of their high fixed costs. In creating their CVP they know based on experience, that the total fixed costs are a combination of 'undistributed expenses' and 80% of the departments total 'Payroll and expenses' as stated in the table below. They also know the total variable costs per department are distributed as follows: rooms 11%, Food and beverage 80% and minor departments 9%. The table below illustrates the Income Statement: 2022 Aug - 2003 (1.iy) Income statement Three years ago they introduced quality philosophy in making sure their consistency of delivery. They see quality as a key for their continuous profitability ambitions. The latest figures for discussion at the board meeting is the problem area of the 'breakfast' as it was unfavourable. The question is how to improve the breakfast operation. The following numbers are now avallable for the last two years. Last year the average price for breakfast 210 , and there were 32000 breakfasts served, which was relatively low. Quality experts recommend that quality costs should be between 24 percent of sales. figures for discussion at the board meeting is the problem area of the 'breakfast' as it was unfavourable. The question is how to improve the breakfast operation. The following numbers are now available for the last two years. Last year the average price for breakfast 10, and there were 32000 breakfasts served, which was relatively low. Quality experts recommend that quality costs should be between 24 percent of sales. Table: Breakfast Total Quality Costs At the same time the new owners have insisted that they recognise they need build on their market position and at least retain it. However, they also insist on increased profitability as part of finance the merger and possibly future investments. Due to these urgent issues and extra board meeting is now arranged. They need to discuss and make a decision by the end of the meeting in how to move forward. 1. In preparation for the meeting use the information above i. Create a contribution format Income statement ii. calculate the break-even point for rooms sold during 2021/2023. iii. Draw a CVP chart of Hotel Znoor Ltd. 5 marks 2. i. Separate out and categorise the quality costs into prevention costs, appraisal (detection) costs, Internal failure costa and Extemal Failure costs. Include the percentage of sale for each category. i. Separate out and categorise the quality costs into prevention costs, appraisal (detection) costs, Internal failure costa and Extemal Failure costs. Include the percentage of sale for each category. (4 marks) ii. Comment on the result that should also include the CVP analysis in (1) on how and why the graph may have shifted from 2021 to 2022. (6 marks) 6 marks 3. Draw on your findings in 1 and 2 , and any other relevant literature, information and calculations you wish to consider, critically discuss two major issues that you think should be the key focus in increasing the profitability as requested by the new owners. Based on your discussion recommend what decision should be made both the short run and the long run. Comment on how this decision will (or not) secure the current market position
