 Please help me figure this out. I would really appreciate it. Thanks.
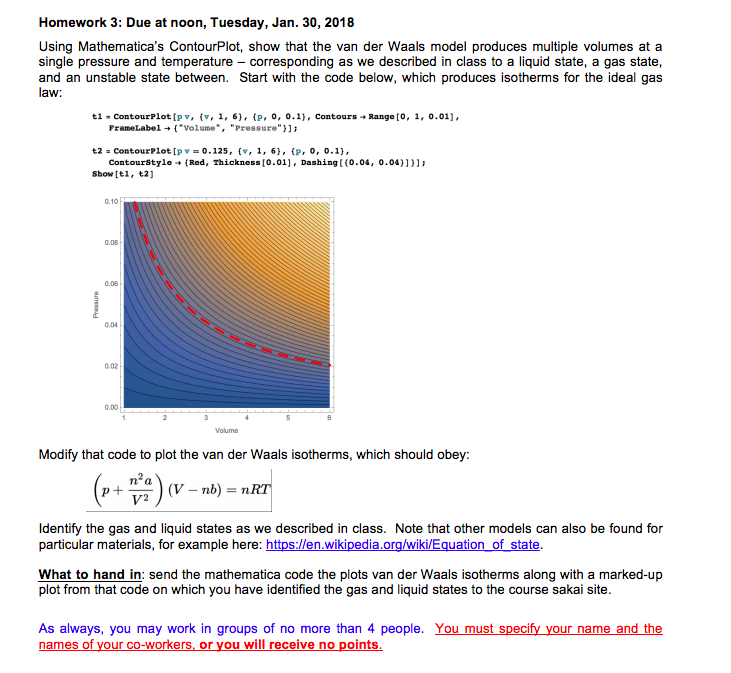
Homework 3: Due at noon, Tuesday, Jan. 30, 2018 Using Mathematica's ContourPlot, show that the van der Waals model produces multiple volumes at a single pressure and temperature - corresponding as we described in class to a liquid state, a gas state, and an unstable state between. Start with the code below, which produces isotherms for the ideal gas law: tl. ContourPlot [pv, {v, 1, PraneLabe1+{"volume", 6), "Pressure"}]; {p, 0, 0.1), Contours Range [O, 1, 0.01], t2 1, 6), contourstyle (Red, Thickness(0.01), Dashing [(0.04, 0.04)))); 0.125, (v, i. {v, {p, 0, 0.1), contourPlot [pv=0.125, Showti,2] 0.08 0.04 0.02 0.00 Modify that code to plot the van der Wals lsotherms, which should obey. n a p ) (V-nb) = n V2 ldentify the gas and liquid states as we described in class. Note that other models can also be found for particular materials, for example here: https:/len.wikipedia.org/wiki/Equation of state. What to hand in: send the mathematica code the plots van der Waals isotherms along with a marked-up plot from that code on which you have identified the gas and liquid states to the course sakai site. As always, you may work in groups of no more than 4 people. You must specify your name and the names of your co-workers, or you will receive no points Homework 3: Due at noon, Tuesday, Jan. 30, 2018 Using Mathematica's ContourPlot, show that the van der Waals model produces multiple volumes at a single pressure and temperature - corresponding as we described in class to a liquid state, a gas state, and an unstable state between. Start with the code below, which produces isotherms for the ideal gas law: tl. ContourPlot [pv, {v, 1, PraneLabe1+{"volume", 6), "Pressure"}]; {p, 0, 0.1), Contours Range [O, 1, 0.01], t2 1, 6), contourstyle (Red, Thickness(0.01), Dashing [(0.04, 0.04)))); 0.125, (v, i. {v, {p, 0, 0.1), contourPlot [pv=0.125, Showti,2] 0.08 0.04 0.02 0.00 Modify that code to plot the van der Wals lsotherms, which should obey. n a p ) (V-nb) = n V2 ldentify the gas and liquid states as we described in class. Note that other models can also be found for particular materials, for example here: https:/len.wikipedia.org/wiki/Equation of state. What to hand in: send the mathematica code the plots van der Waals isotherms along with a marked-up plot from that code on which you have identified the gas and liquid states to the course sakai site. As always, you may work in groups of no more than 4 people. You must specify your name and the names of your co-workers, or you will receive no points